Community scripts › Authors
The founder account. Every indicator in Depth was built here, on the real order book, trades and liquidations, plus open-source scripts anyone can copy.
Most used today live, by traders turning them on
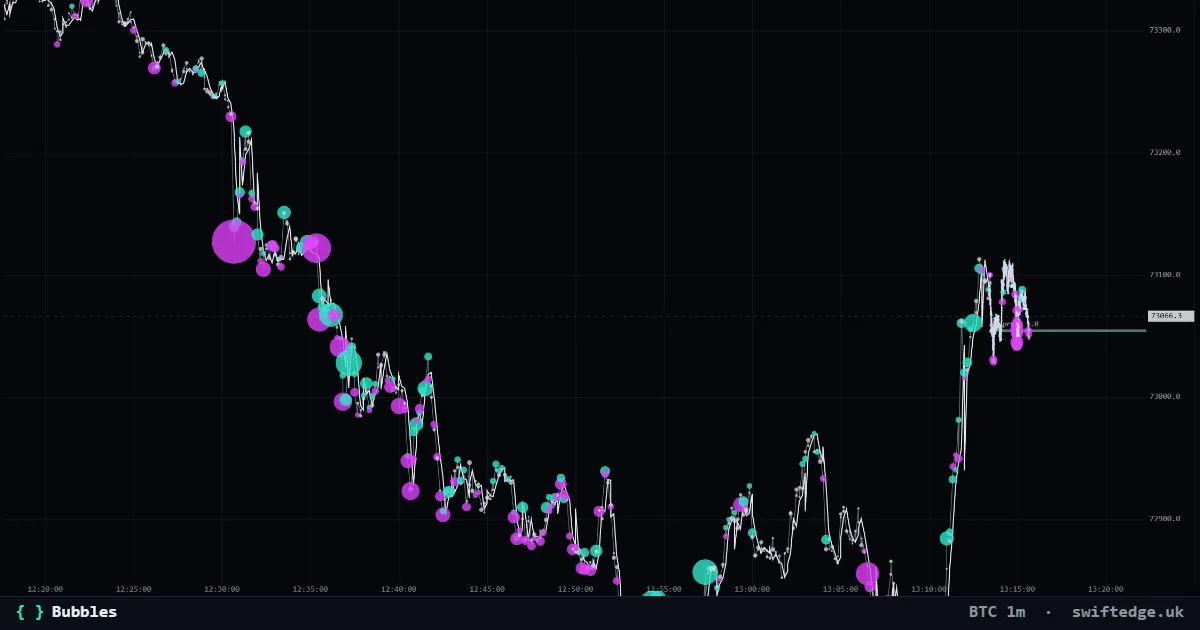
Every trade as a bubble: teal for aggressive buys, violet for aggressive sells; the size is the volume.
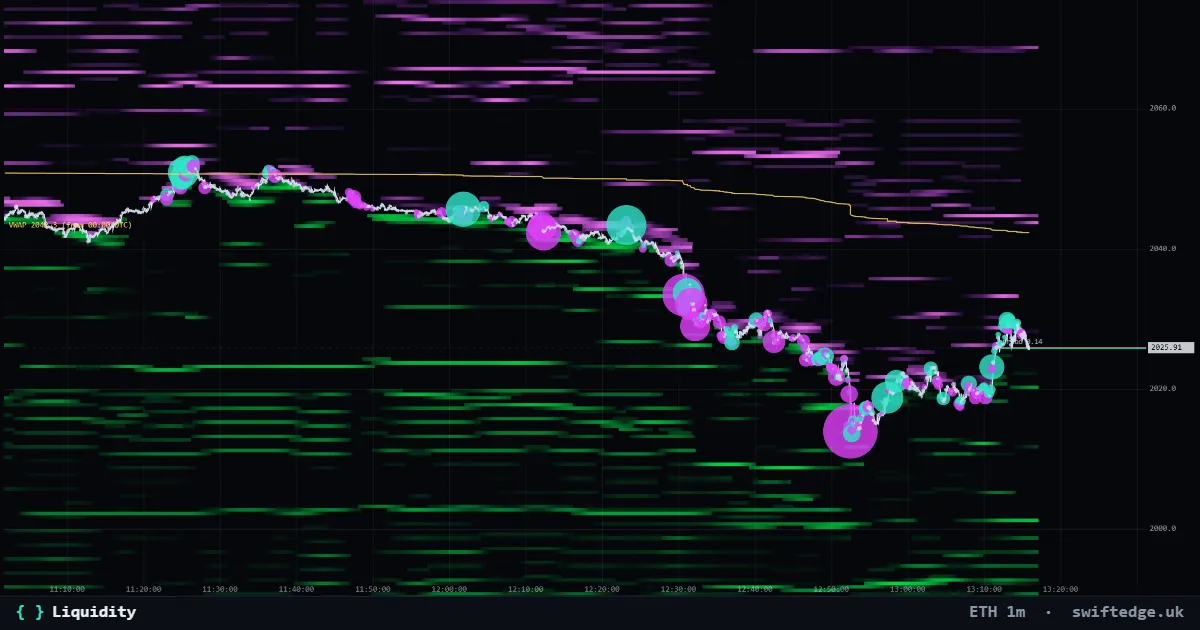
Resting limit orders in the order book by price and time: green bids below price, violet asks above. Brighter means more size.
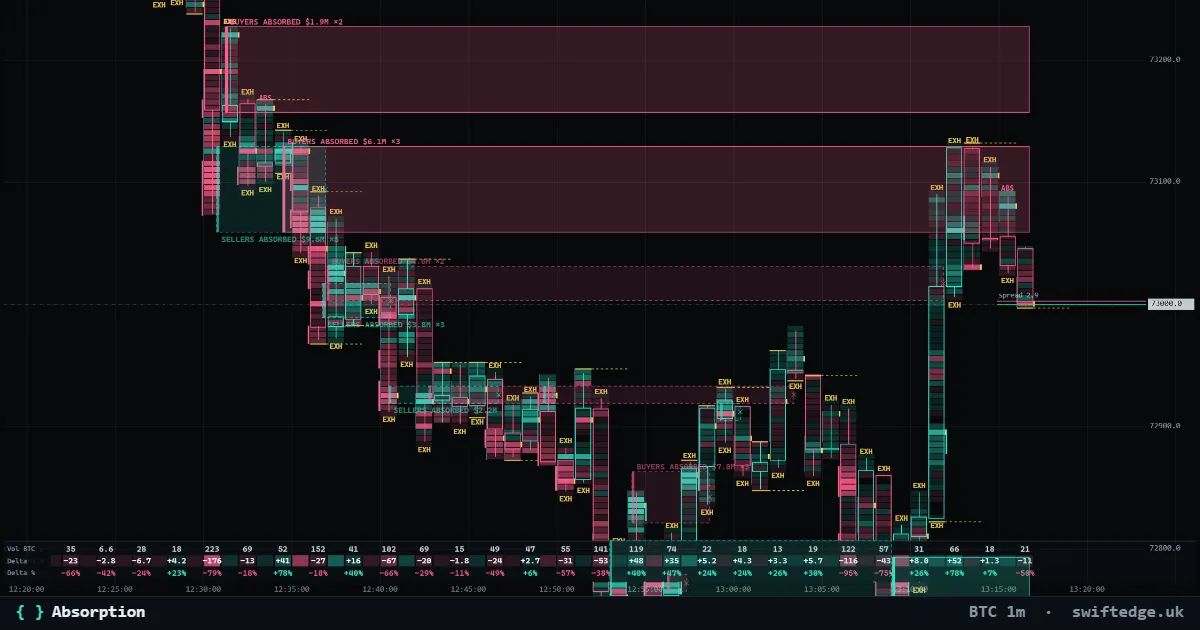
Zones where heavy aggressive selling (or buying) hit a price level and price did not get through; the zone runs until price trades past it.
Built into Depth 51 indicators, free and ◆ Plus
Swiftedge Plus · 13
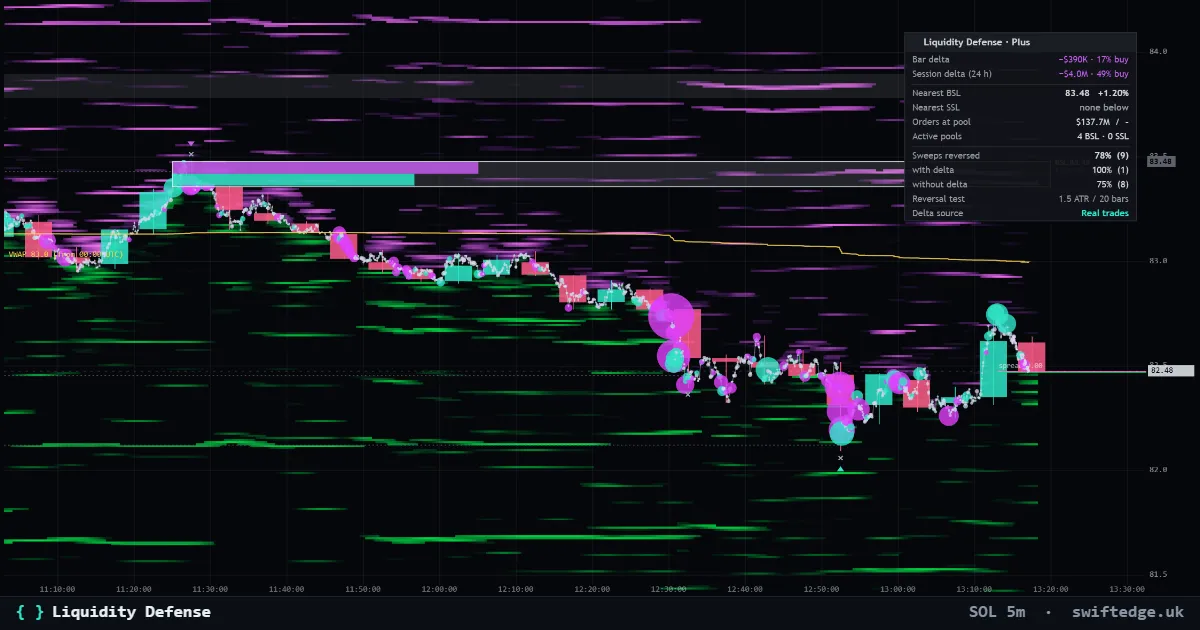
Buy-side and sell-side pools above highs and below lows with formation, defense profile and sweeps, from real trades, with the orders and liquidations at the nearest pools.
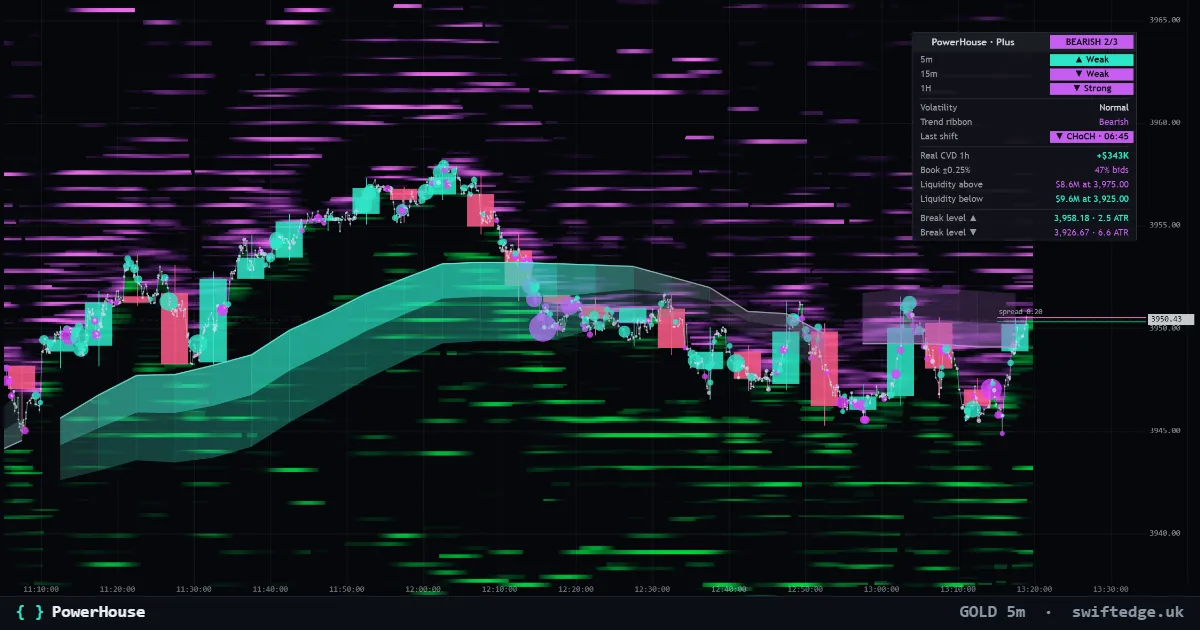
The adaptive trend ribbon, structure shifts (CHoCH and BOS) and a Trend Matrix, with the real walls and liquidation clusters above and below price.
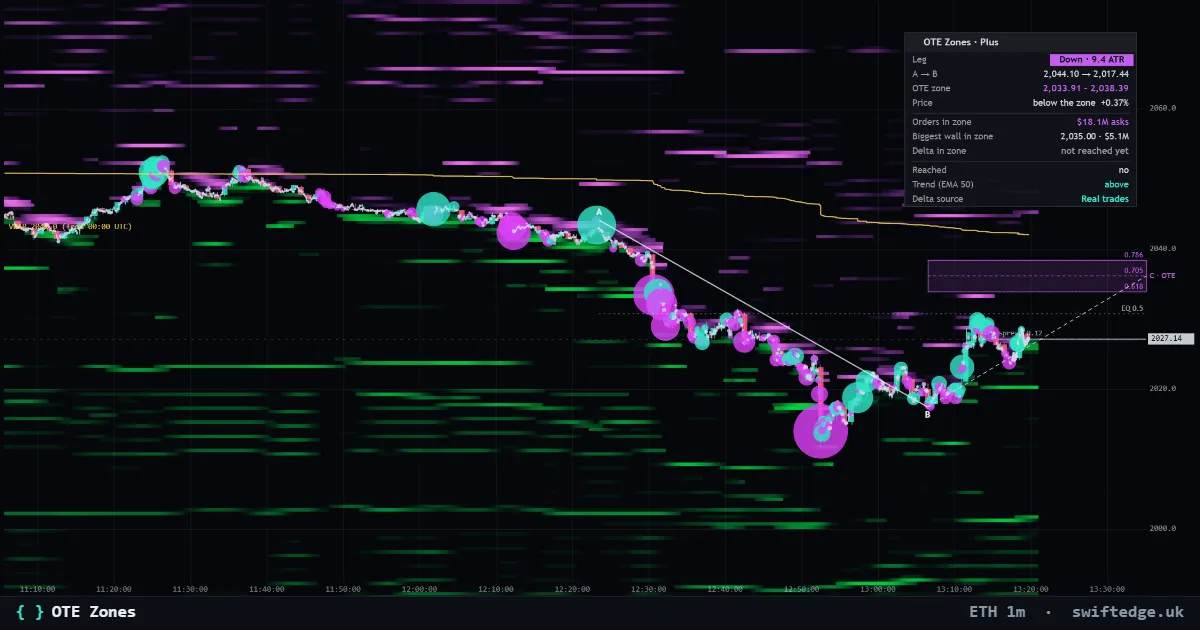
The latest impulse leg A to B and its optimal trade entry zone (0.618 to 0.786), with the real orders and liquidations inside the zone and who traded when price was in it.
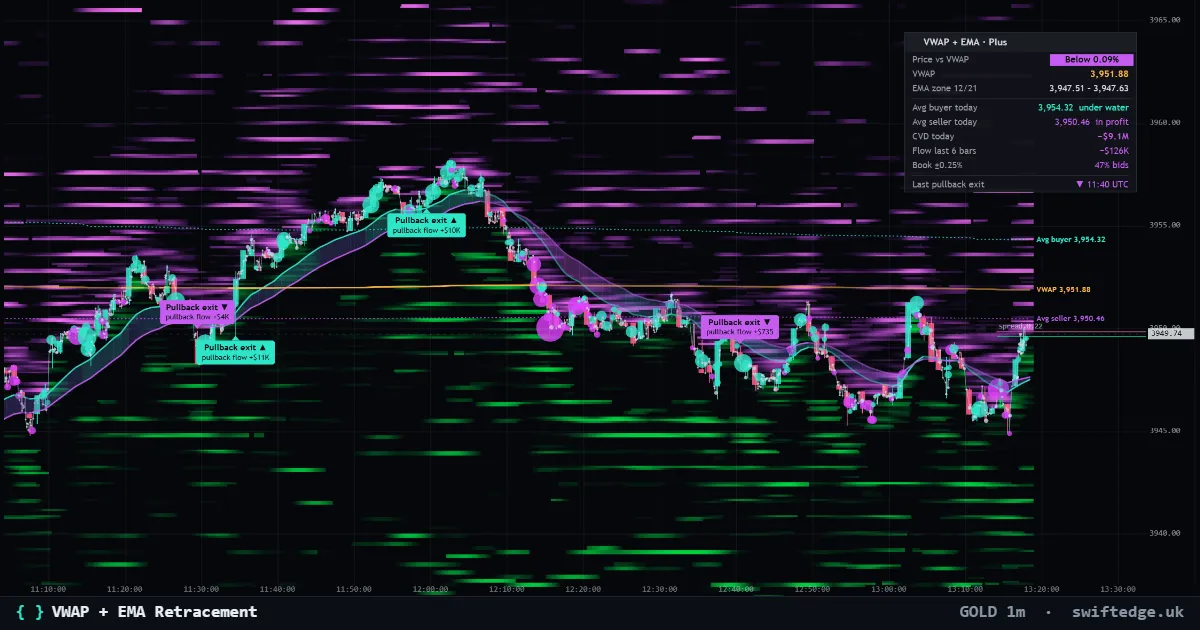
VWAP and the EMA 12/21 zone with pullback exits, the zone colored by real flow and where today's average buyer and seller got in.
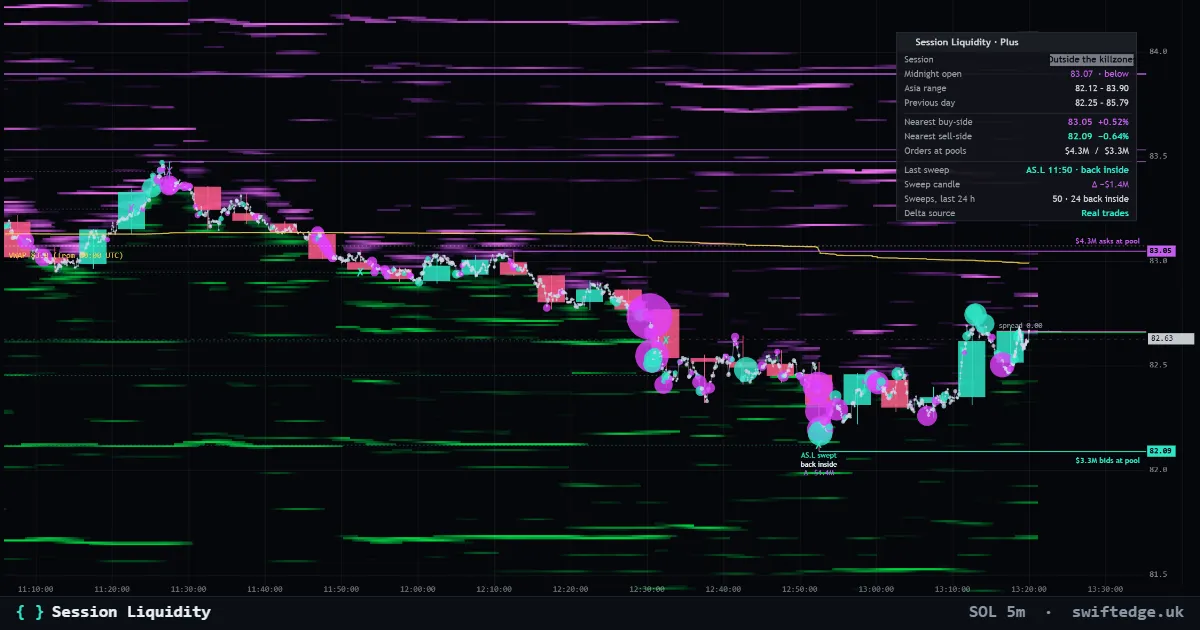
Asia, London and New York killzones with the session pools (Asia high and low, previous day high and low, equal highs and lows) and every sweep, with the real delta and liquidations of the sweep.
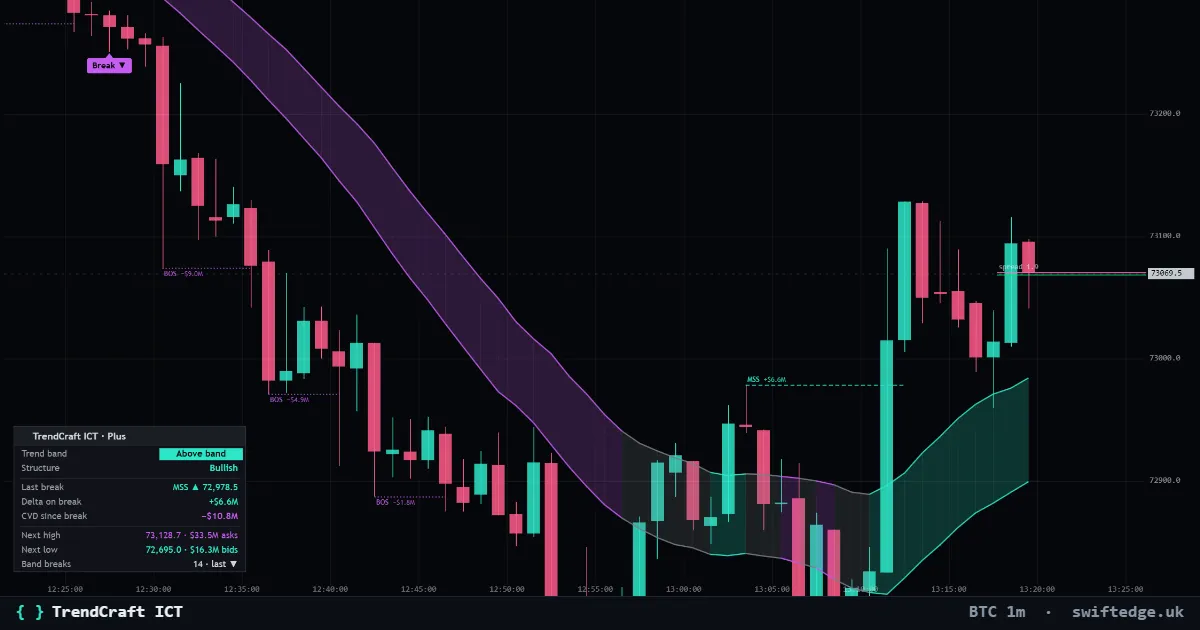
An SMA band of highs and lows with BOS and MSS lines and break marks, with the real delta on every break and the walls behind the next structure levels.
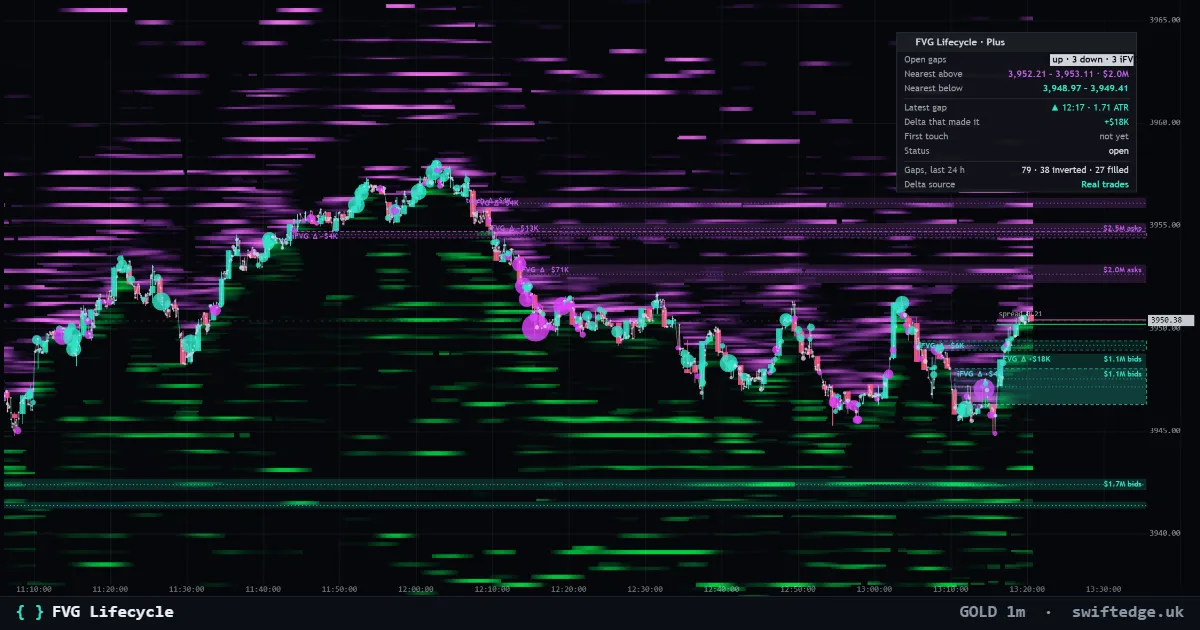
Fair value gaps from displacement through their life: shrinking as they fill, removed when filled and turned into inverted gaps when closed through, with the real delta that made each gap and the real orders inside it.
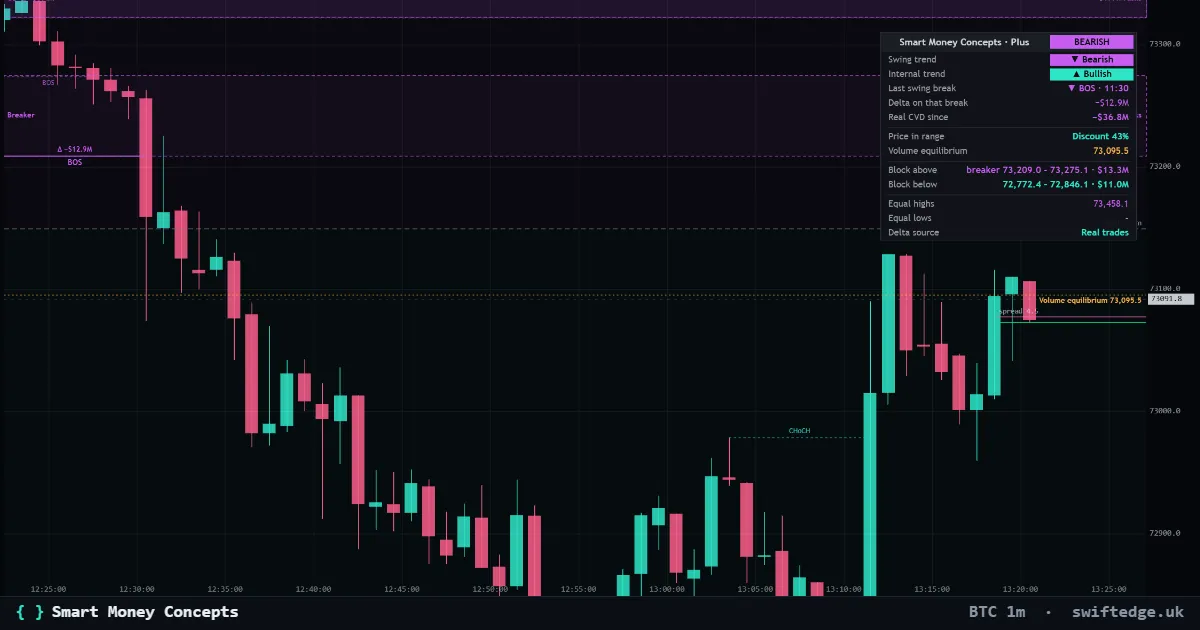
Swing and internal structure (BOS and CHoCH), order blocks and breakers, equal highs and lows and the premium and discount zones, with the real delta that built each block, the real orders and liquidations inside it and the liquidity behind every equal high and low.
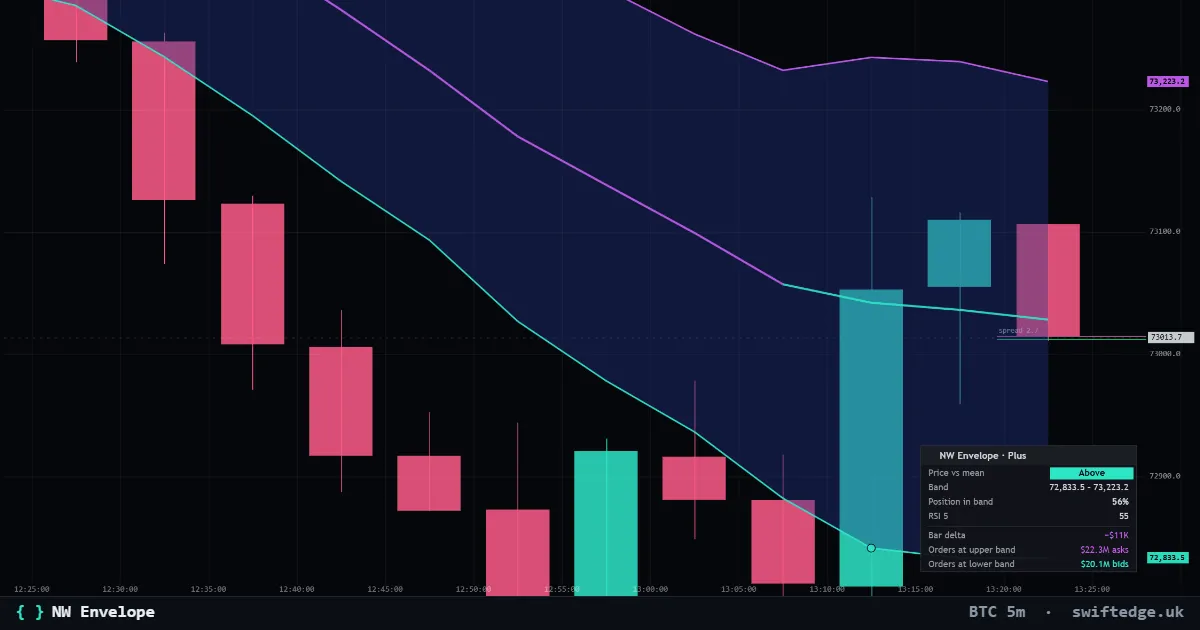
A Nadaraya-Watson mean with an ATR envelope and back-inside marks, with the real order book inside the band and the liquidations just outside.
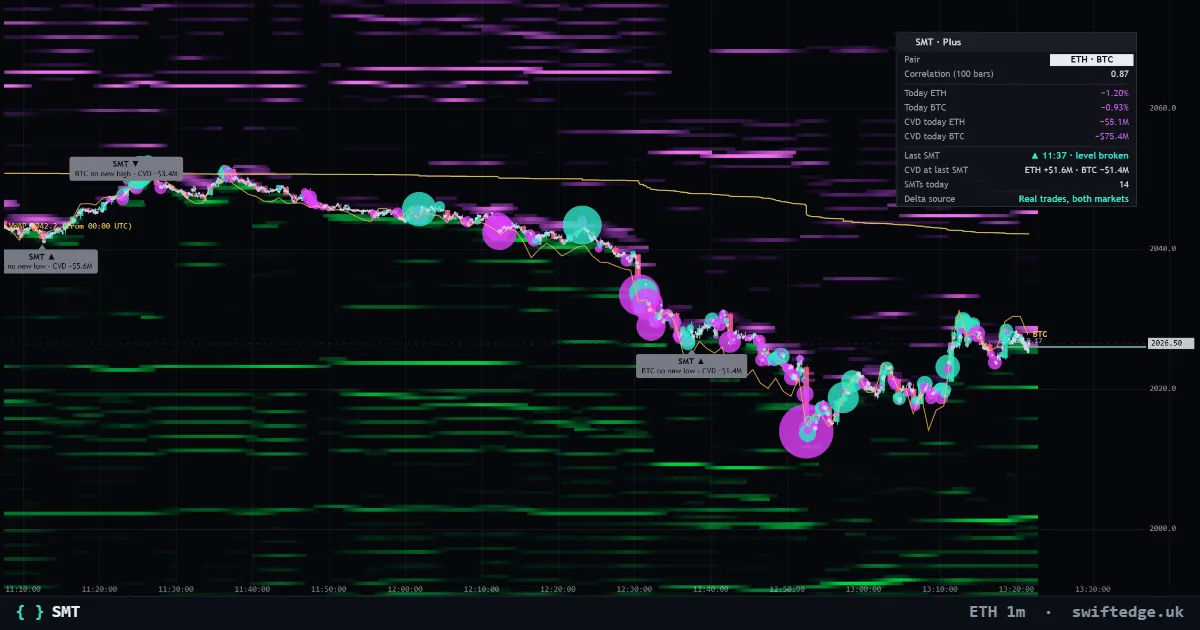
Smart money divergence against the correlated market (Bitcoin and Ethereum, gold and silver, US 500 and US 100), with the correlated market drawn on the chart and the real CVD of both at every divergence.
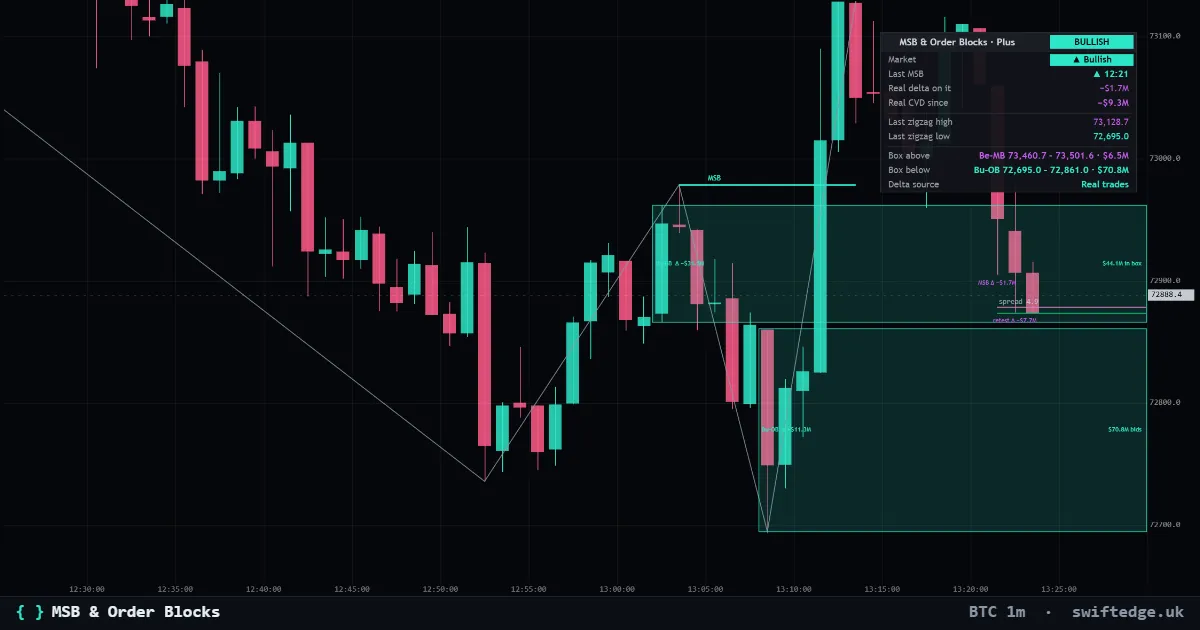
The zigzag, every market structure break (MSB) and the order block and breaker or mitigation block each break leaves, with the real delta that built each block and broke the structure, and the real orders and liquidations inside every block.
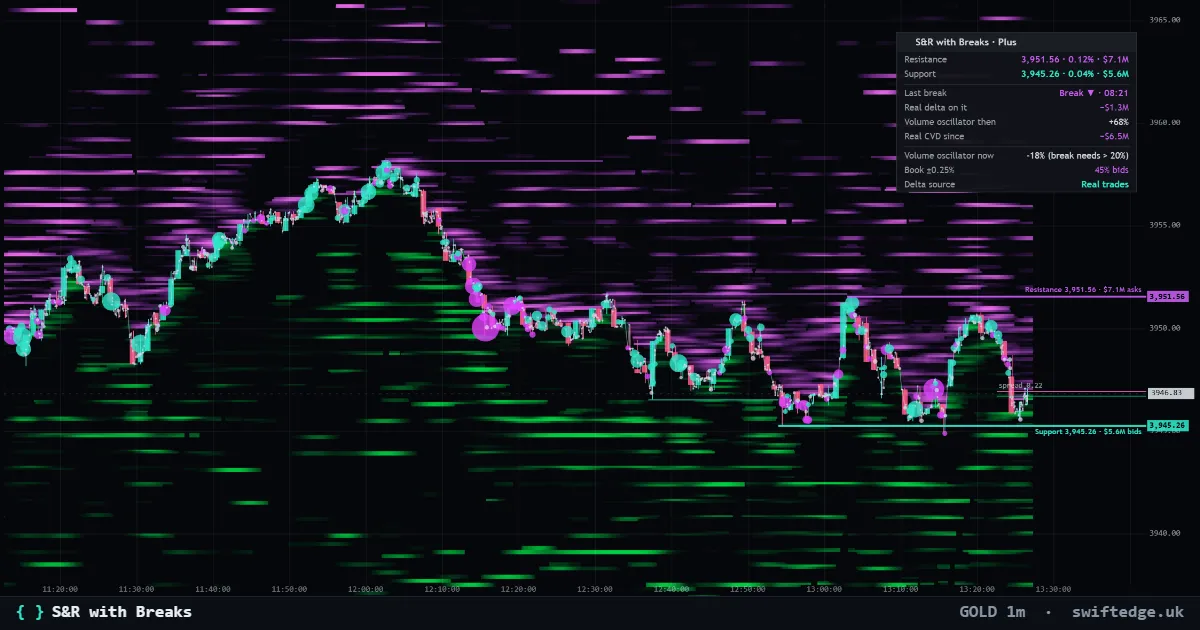
Support and resistance from pivot highs and lows with every break marked, the break confirmed by volume as in the original and by the real delta of the breaking candle, and the real orders and liquidations at each level.
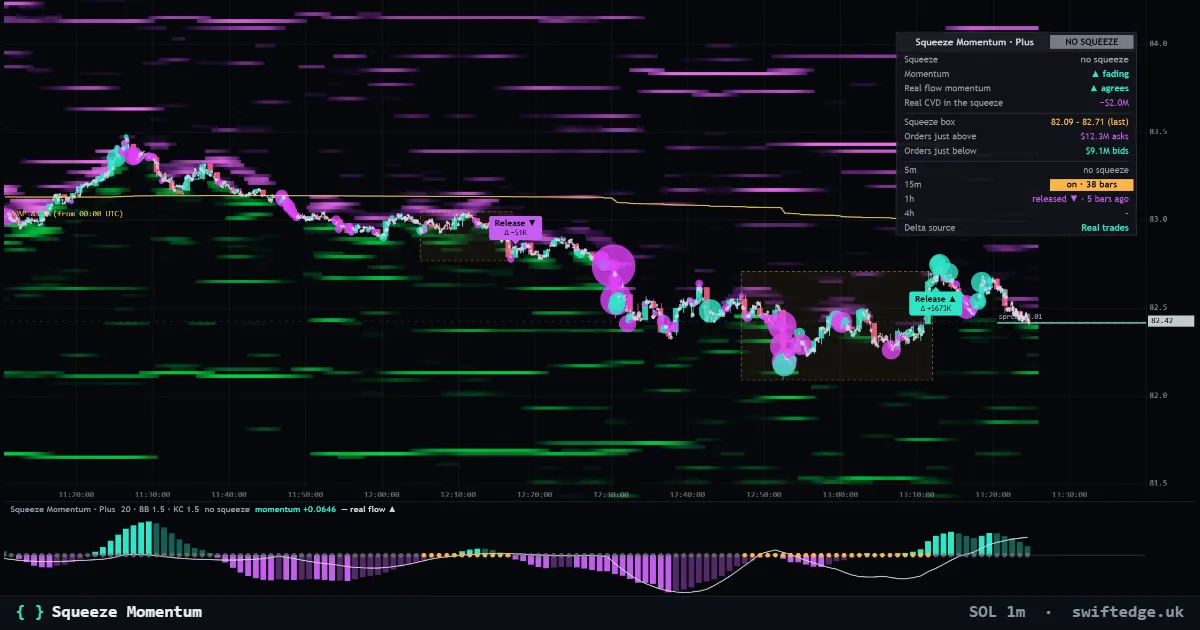
The squeeze (Bollinger Bands inside the Keltner Channel) and its momentum histogram in a pane, with the same momentum on the real cumulative delta, the squeeze box on the price chart with the real orders and liquidations just outside it, and the squeeze on 5m, 15m, 1h and 4h.
Order flow · 11
Every trade as a bubble: teal for aggressive buys, violet for aggressive sells; the size is the volume.
Resting limit orders in the order book by price and time: green bids below price, violet asks above. Brighter means more size.
Zones where heavy aggressive selling (or buying) hit a price level and price did not get through; the zone runs until price trades past it.
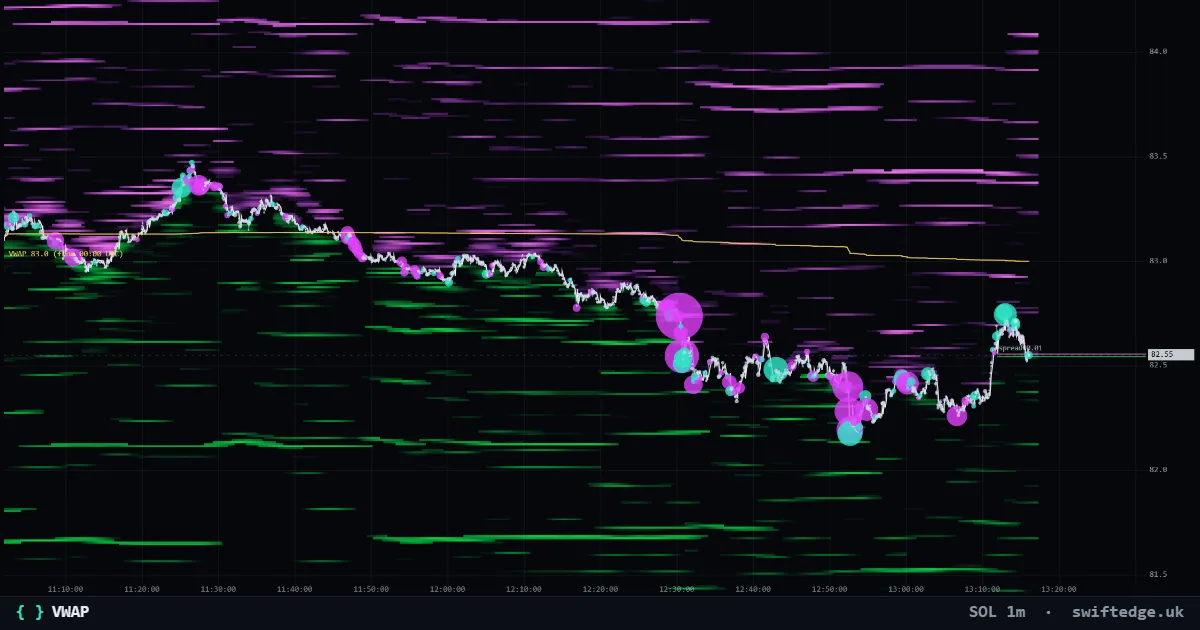
The volume-weighted average price since 7:00 PM ET (00:00 UTC): the average price paid per coin today.
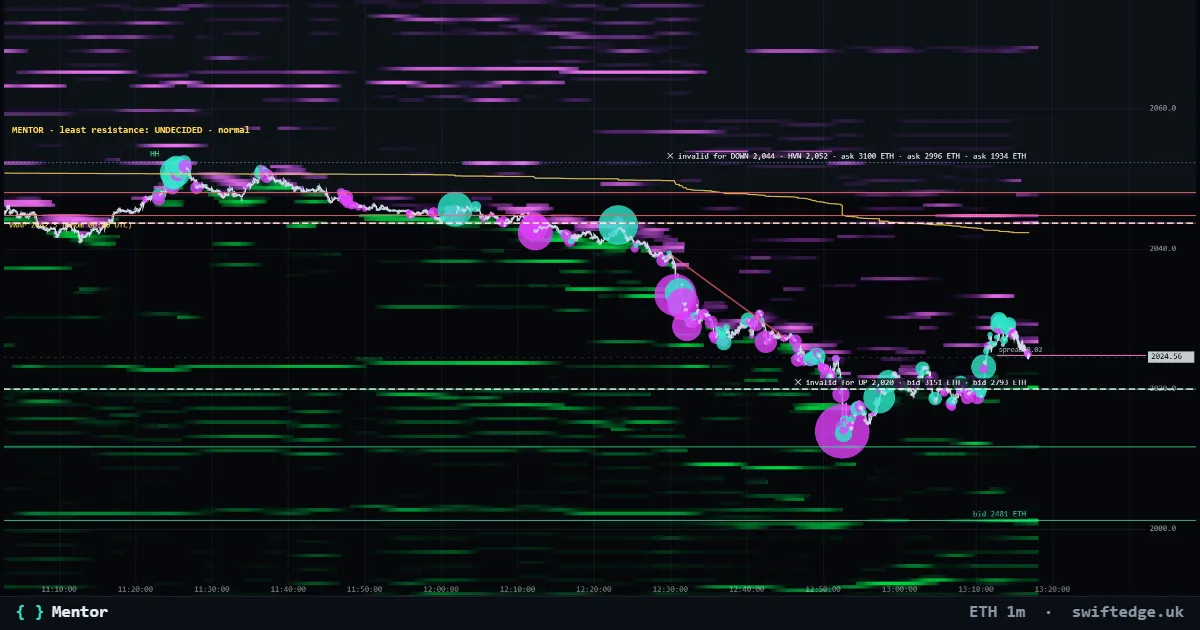
A rule-based reading of the chart in seven steps: structure, liquidity, volume profile, flow, timeframes and positioning, with an invalidation level.
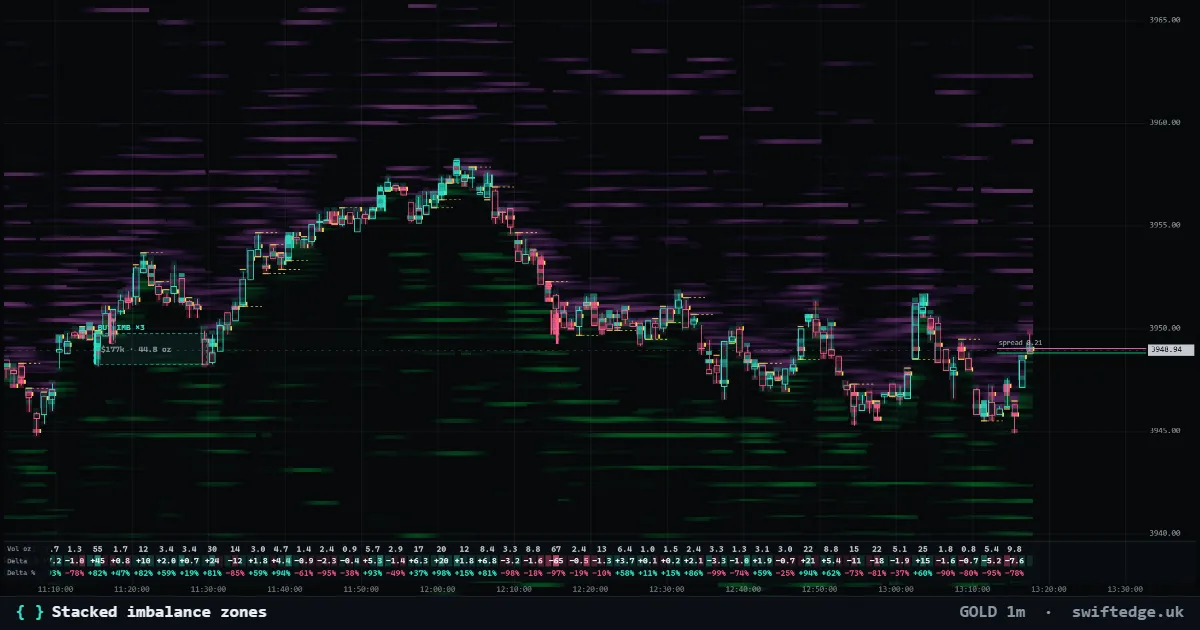
Zones where aggressive buyers (or sellers) outweighed the other side several times over on several price levels in a row.
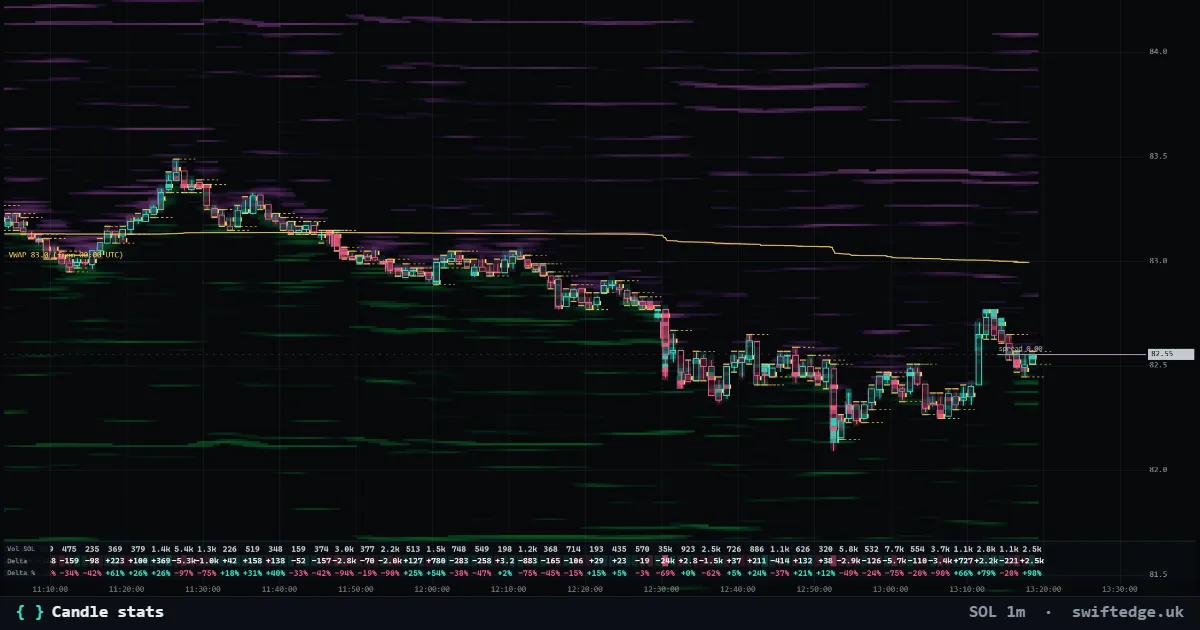
The footprint's stats table under normal candles: volume, delta and delta % for every candle, optionally buy, sell and cumulative delta, in coin or USD.
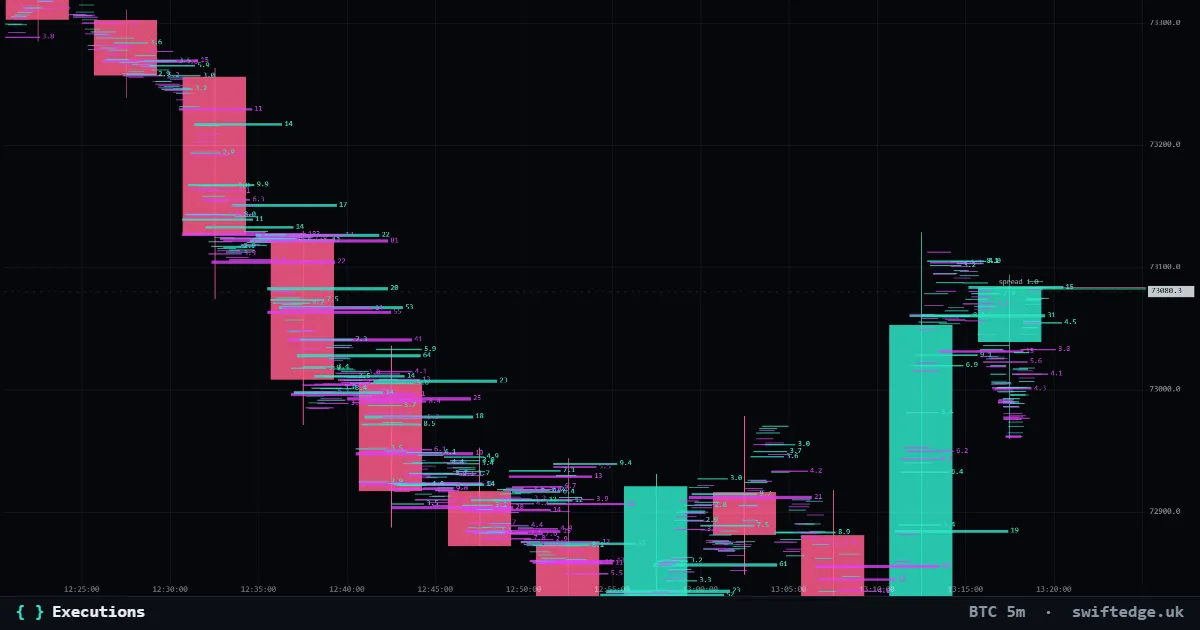
Lasers across the chart for unusually large trades, so they stay visible when you zoom out.
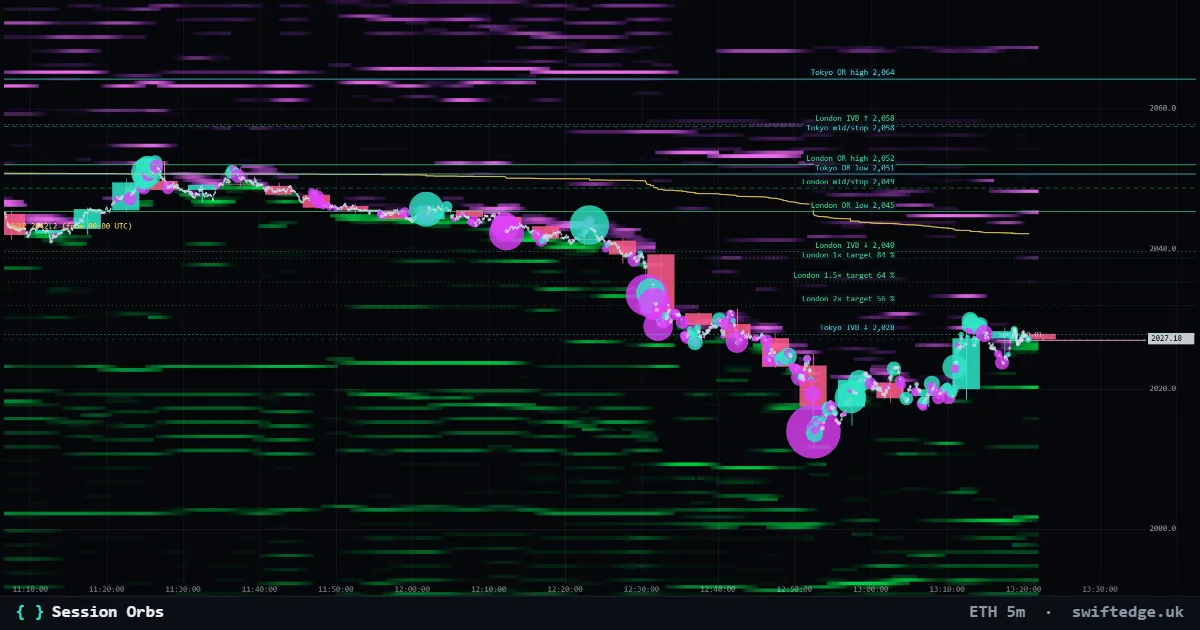
The opening range of the Tokyo, London and New York sessions, with targets and how often they were reached historically.
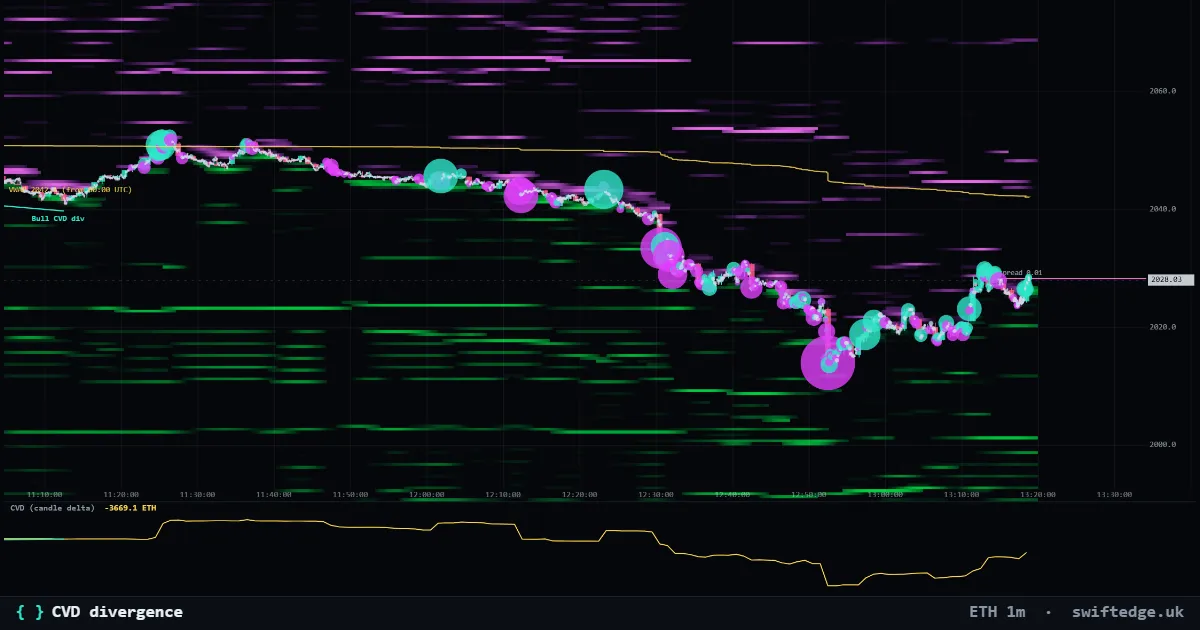
Marks where price made a higher high (or lower low) while cumulative volume delta did not, on the chart and in a CVD pane, with an optional alert.
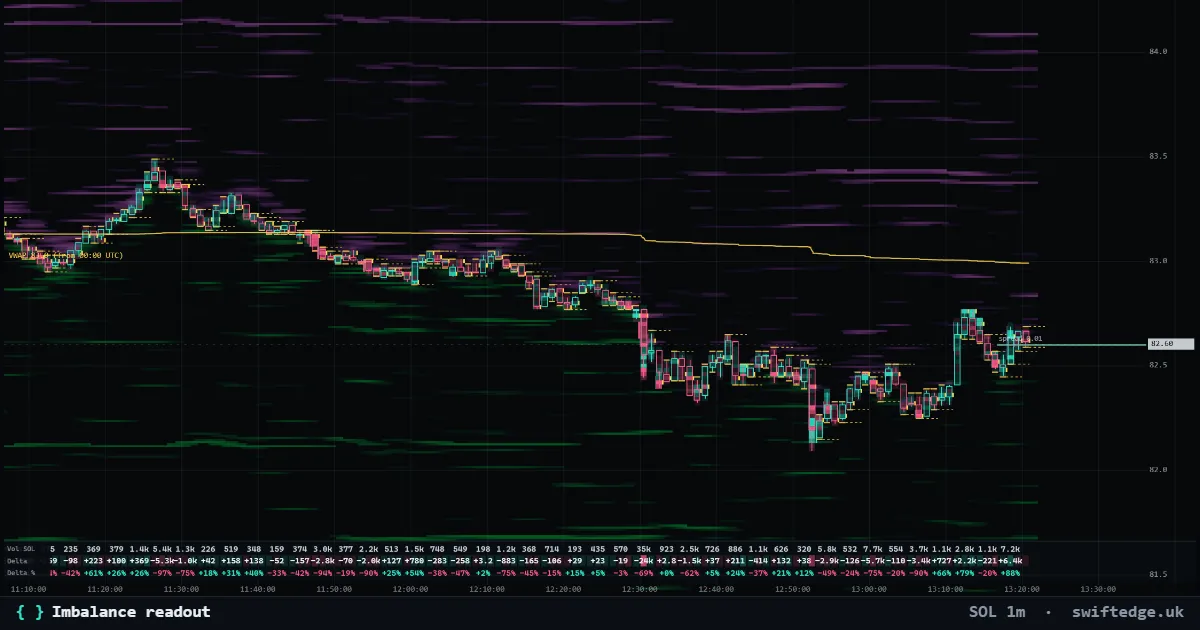
Two live numbers: how lopsided the order book is near price, and how lopsided aggressive volume was in the last minute.
Liquidations & positioning · 3
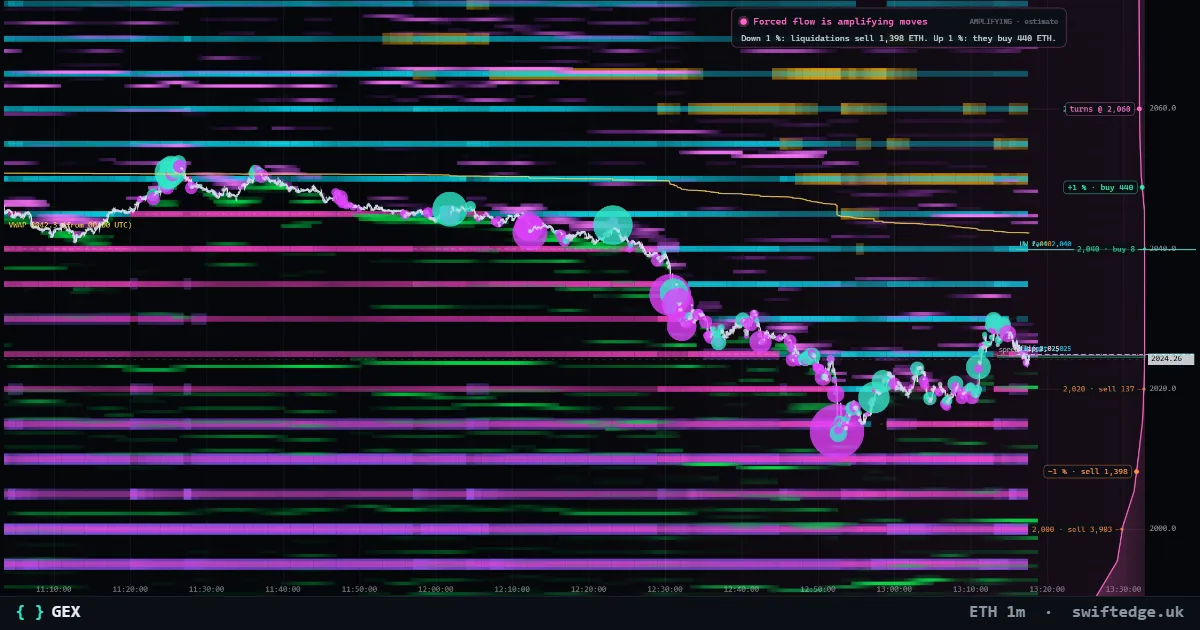
GEX for Bitcoin, Ethereum and Solana, the options gamma by price with the gamma flip, call wall and put wall, computed in your browser from public options data. Gold: where leveraged positions would be liquidated (Swiftedge Positioning).
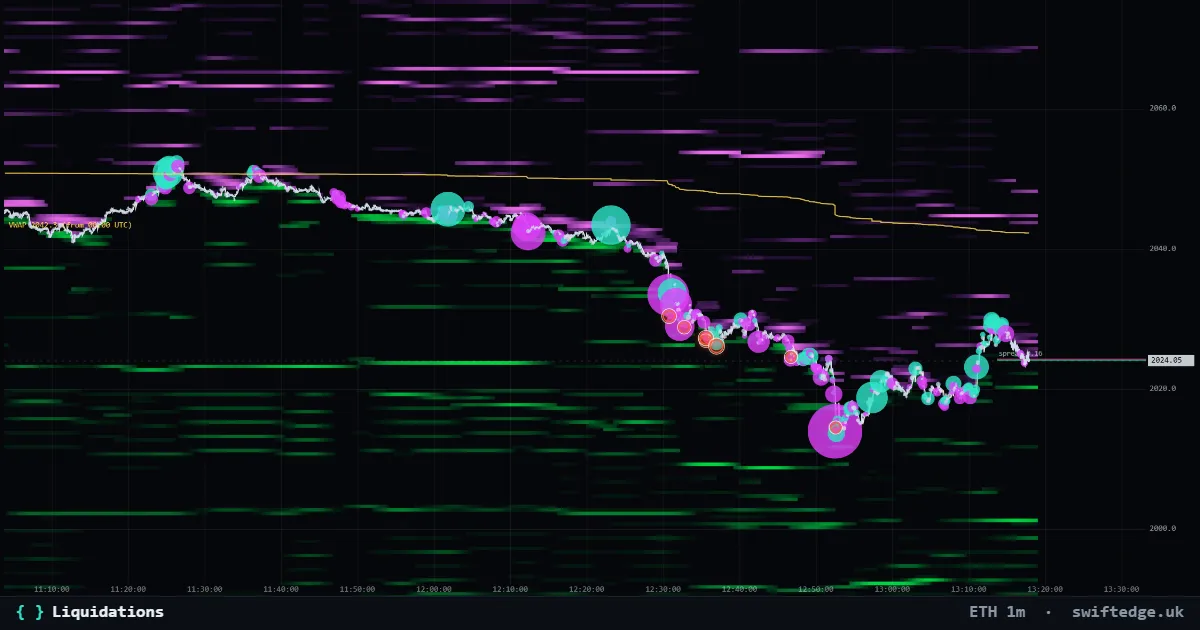
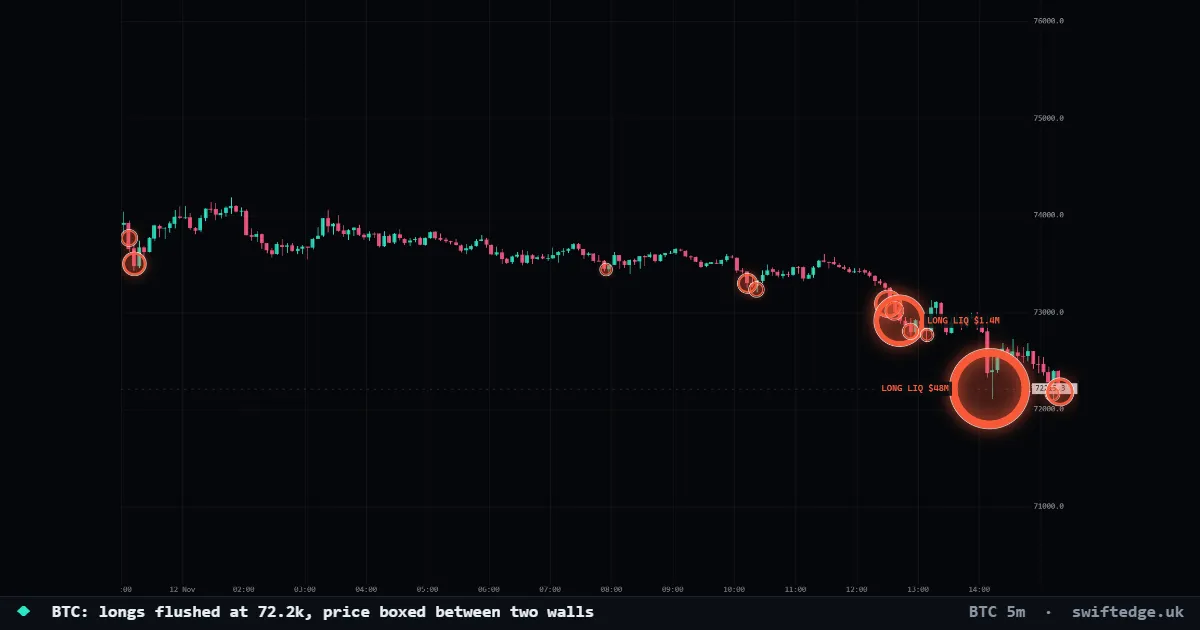
Real forced closes in perpetual futures: orange when a long was liquidated, cyan when a short was; size by dollar value.
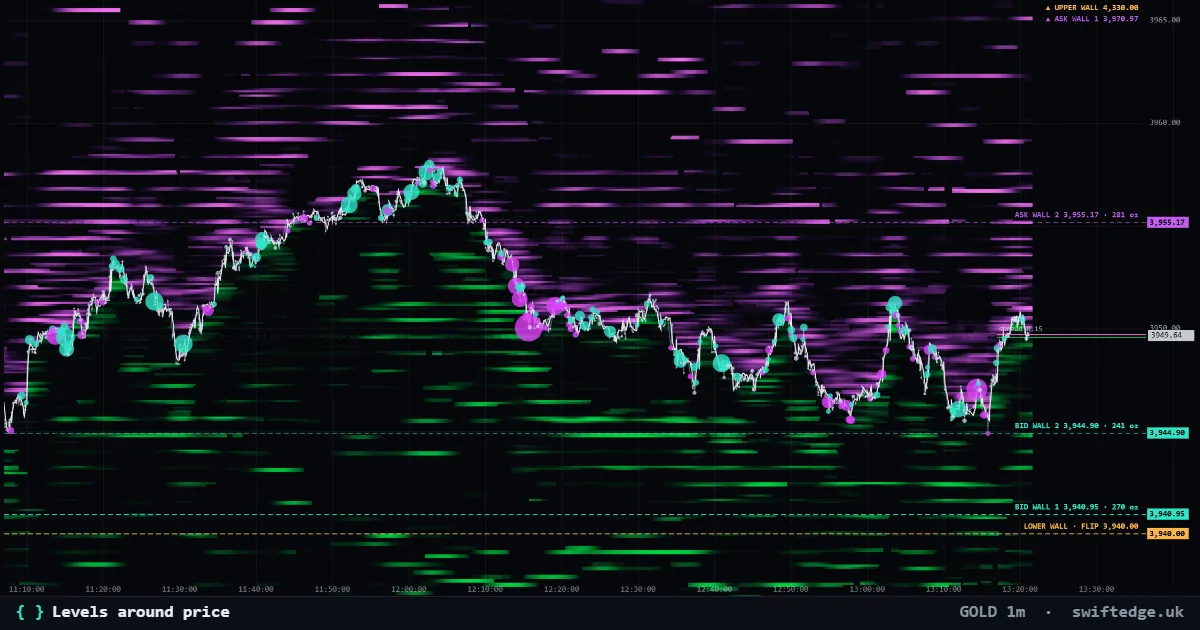
The biggest bid and ask walls near the price and the Positioning levels (upper wall, lower wall, flip, max liquidation) as lines with name and price. Pick which levels to show in the settings.
Volume & VWAP · 3
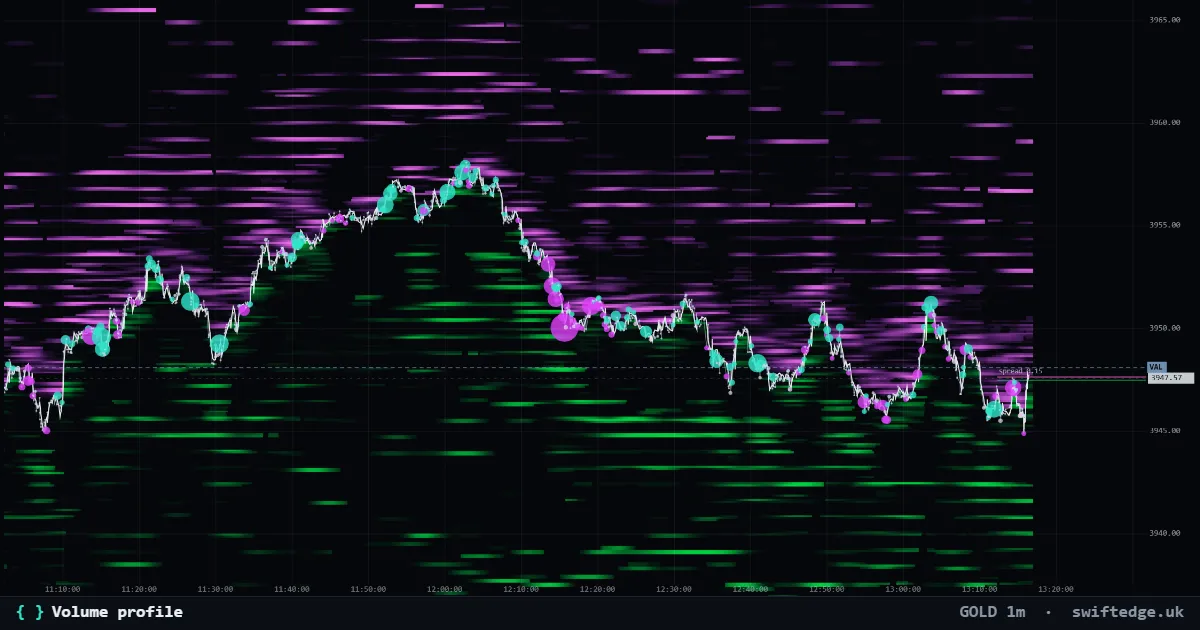
Traded volume at each price per day, session, week, a composite of the last hours or the visible range, with POC, value area and naked POCs.
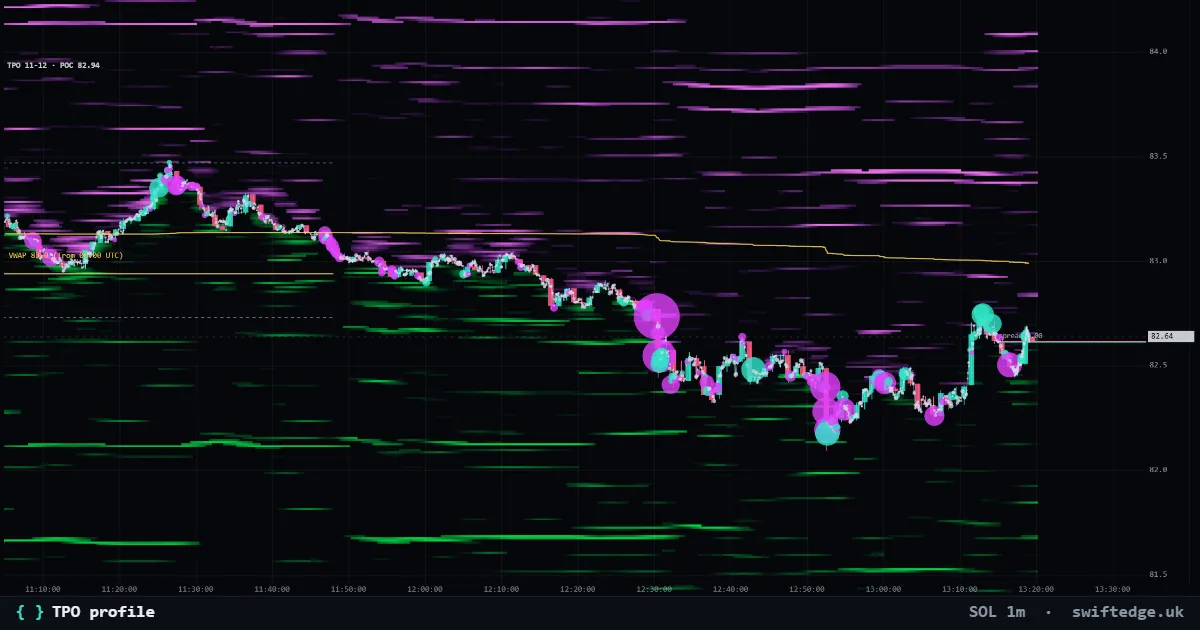
Market profile: a letter for every 30 minutes price traded at each level, with POC, value area, initial balance and single prints.
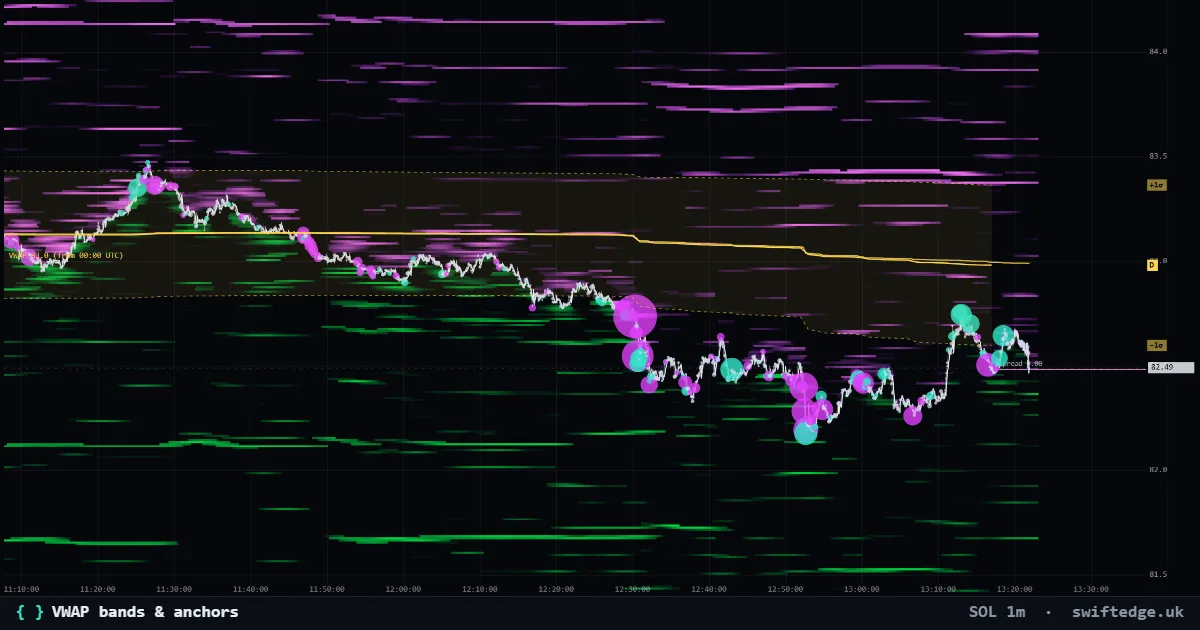
Daily, session, weekly, monthly and rolling VWAPs, with ±1, 2 and 3 standard deviation bands.
Classic indicators · 20
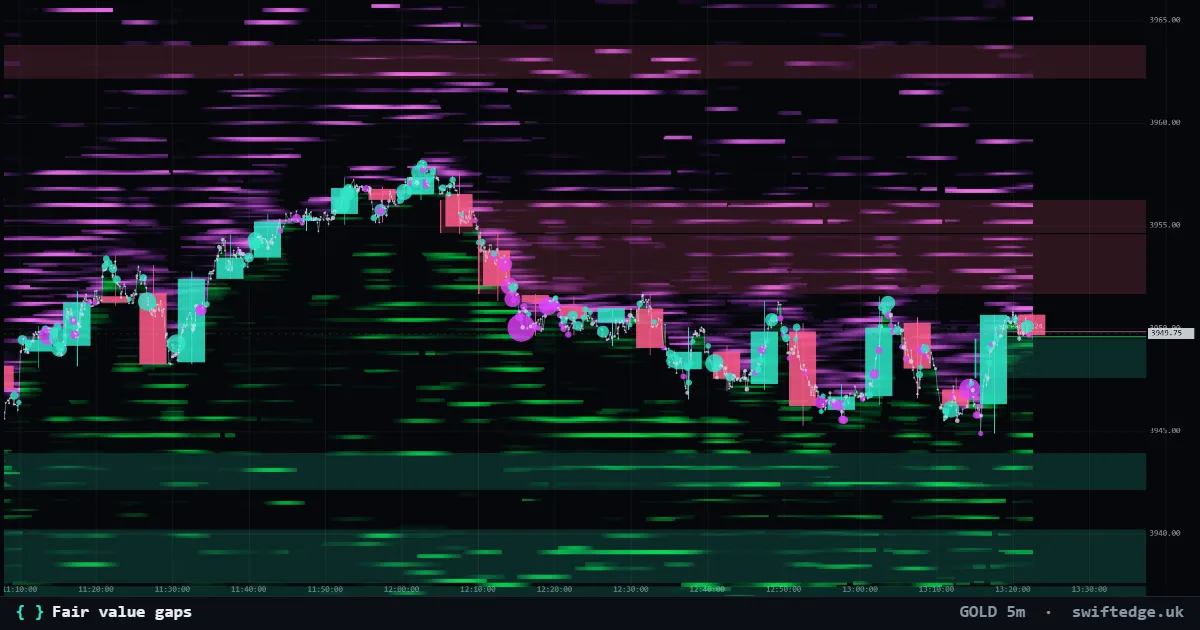
Three-candle gaps where price moved too fast to trade both ways; shown until price fills them.
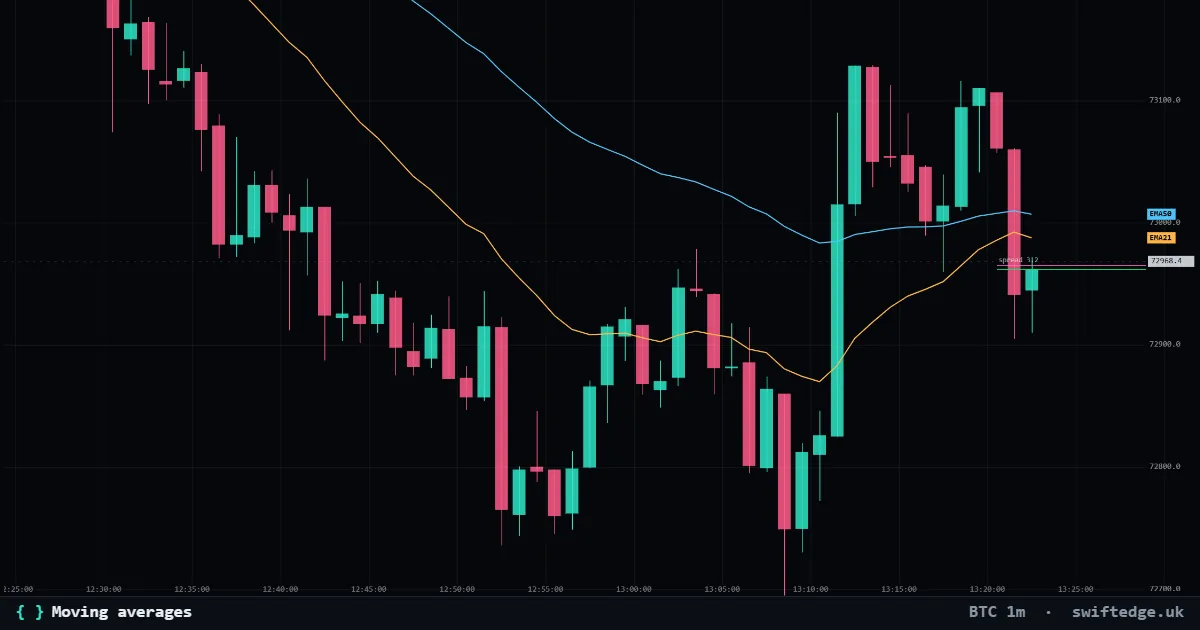
Up to three simple, exponential or weighted moving averages of the close.
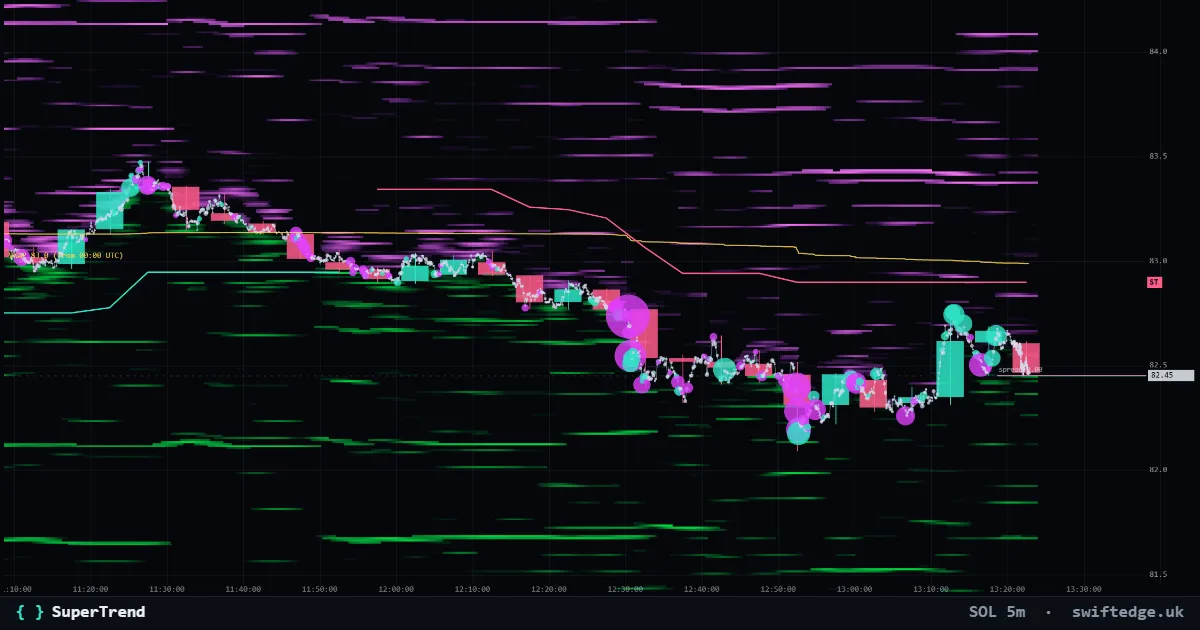
An ATR trailing line under price in uptrends and over price in downtrends; it flips when a candle closes through it.
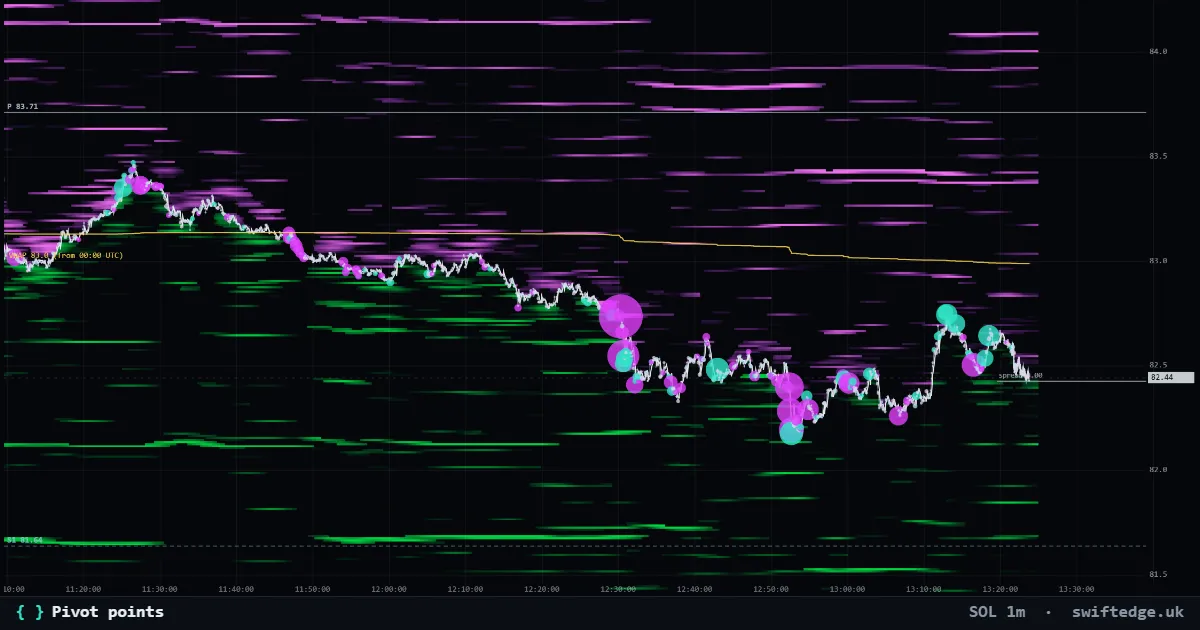
Classic, Fibonacci or Camarilla pivots from the previous day's or week's high, low and close.
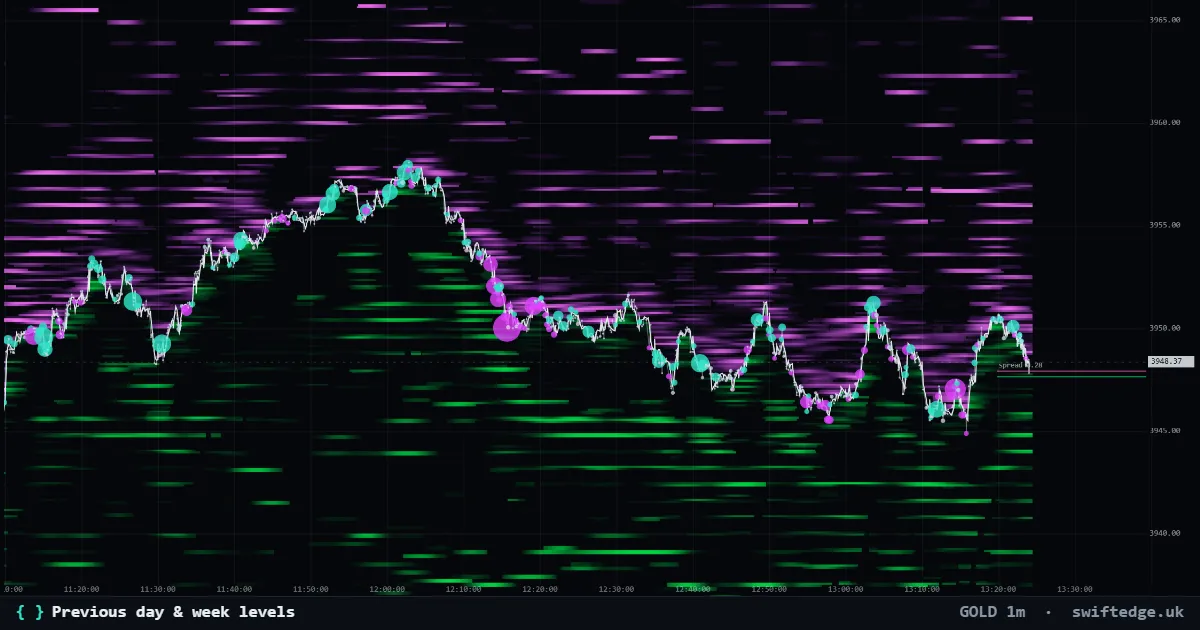
Yesterday's and last week's high, low and close, and today's open at 7:00 PM ET (00:00 UTC).
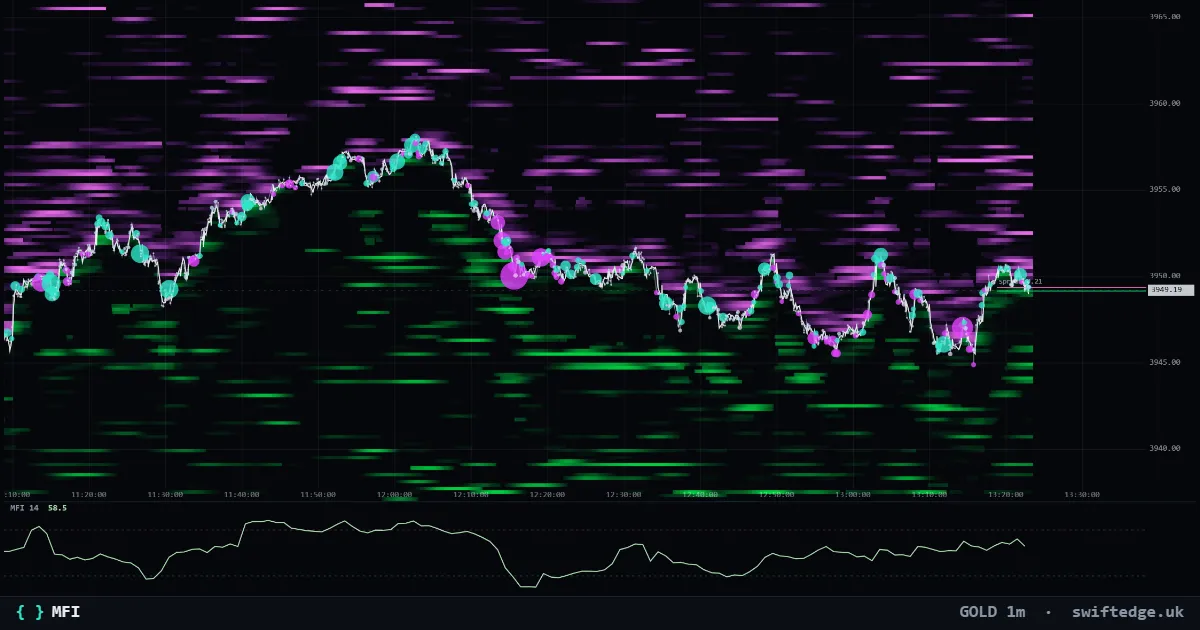
Money flow index (0-100) in a pane: an RSI weighted by volume.
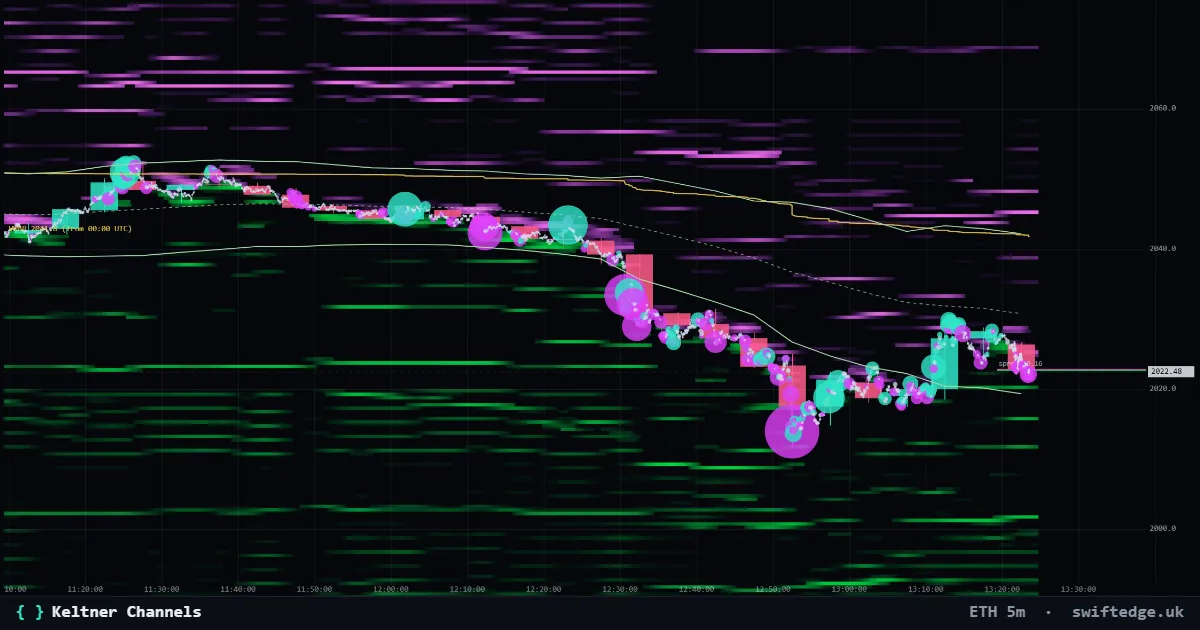
An EMA with bands a multiple of the average true range away.
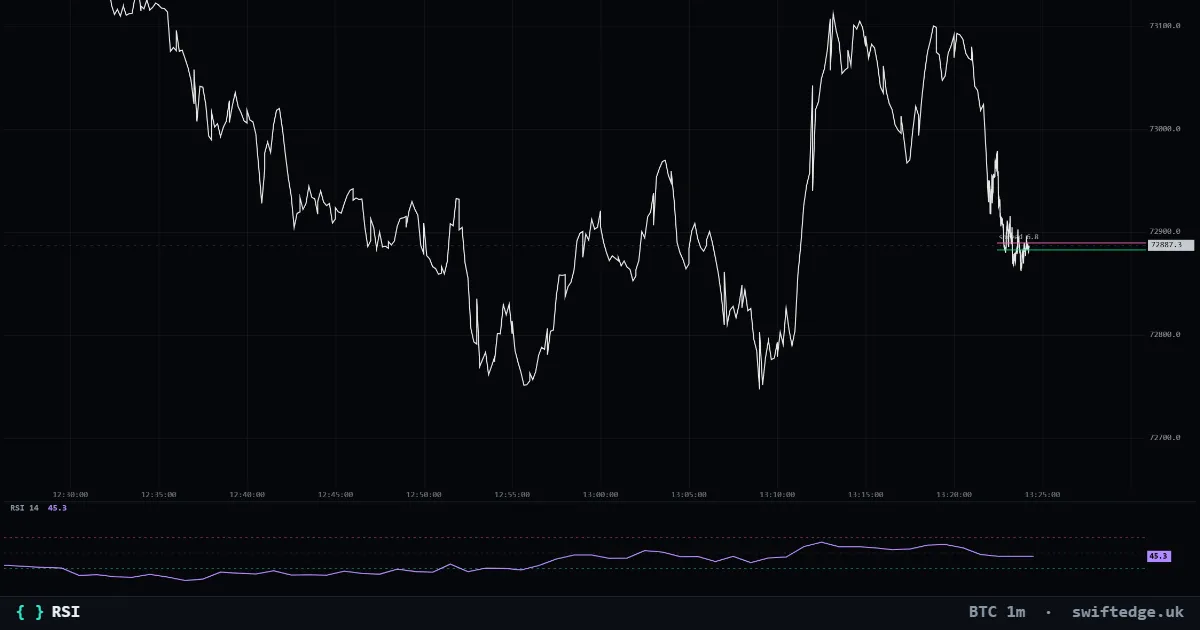
Relative strength index (0-100) in a pane, with 70/30 lines and an optional moving average.
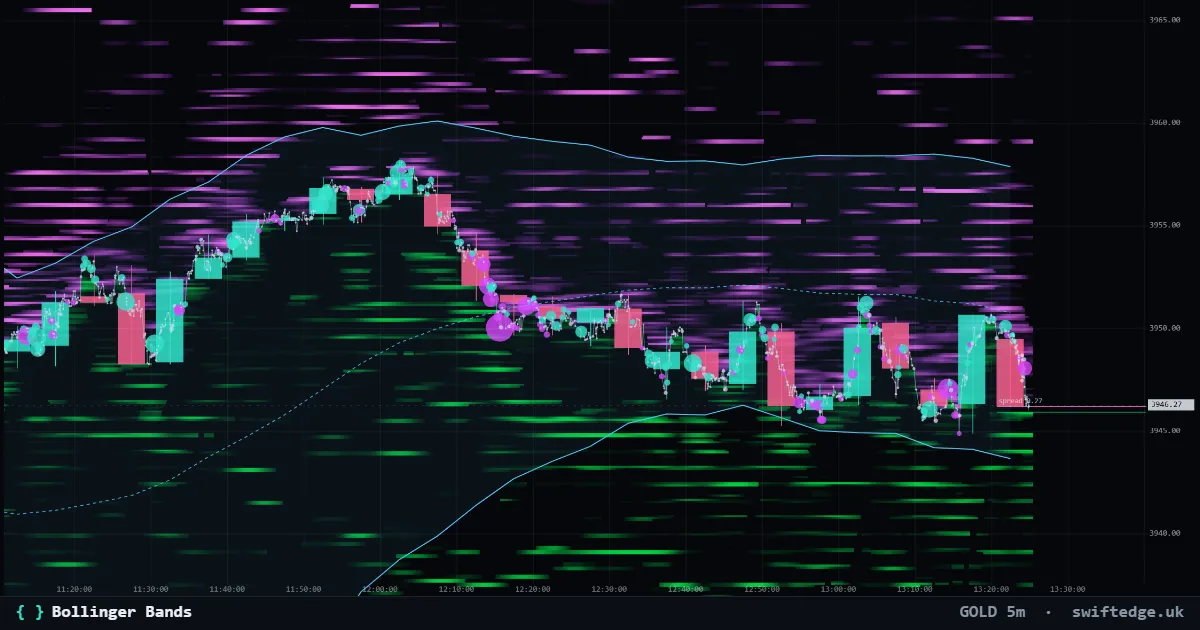
A moving average with bands a number of standard deviations above and below.
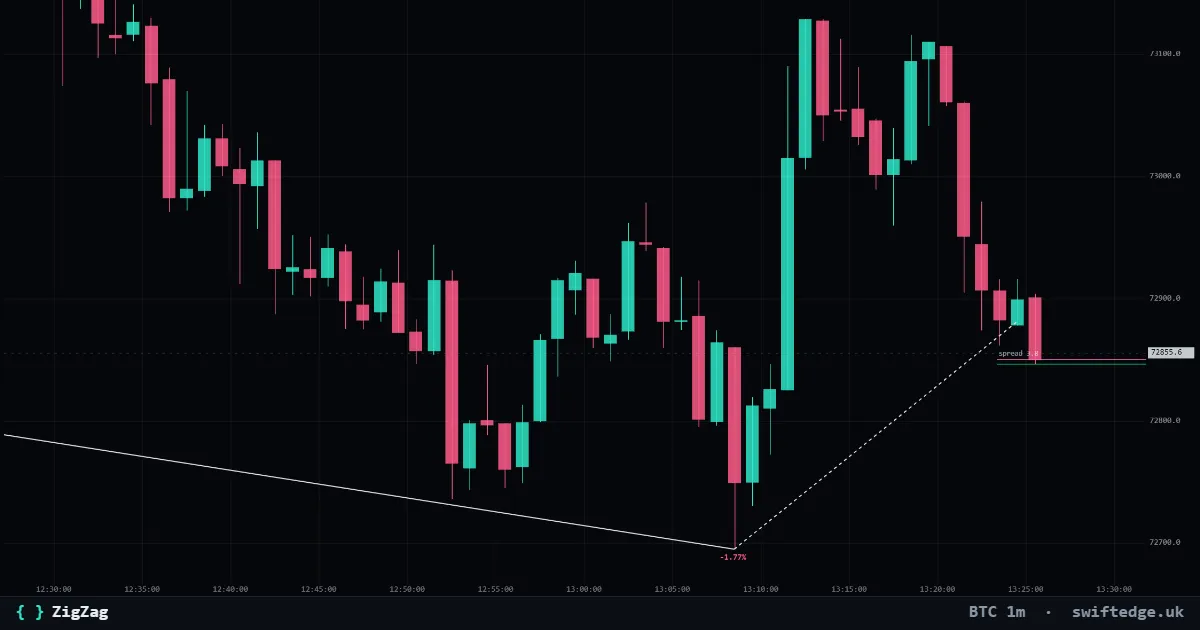
Connects swing highs and lows that moved at least a set percentage, with the size of each swing.
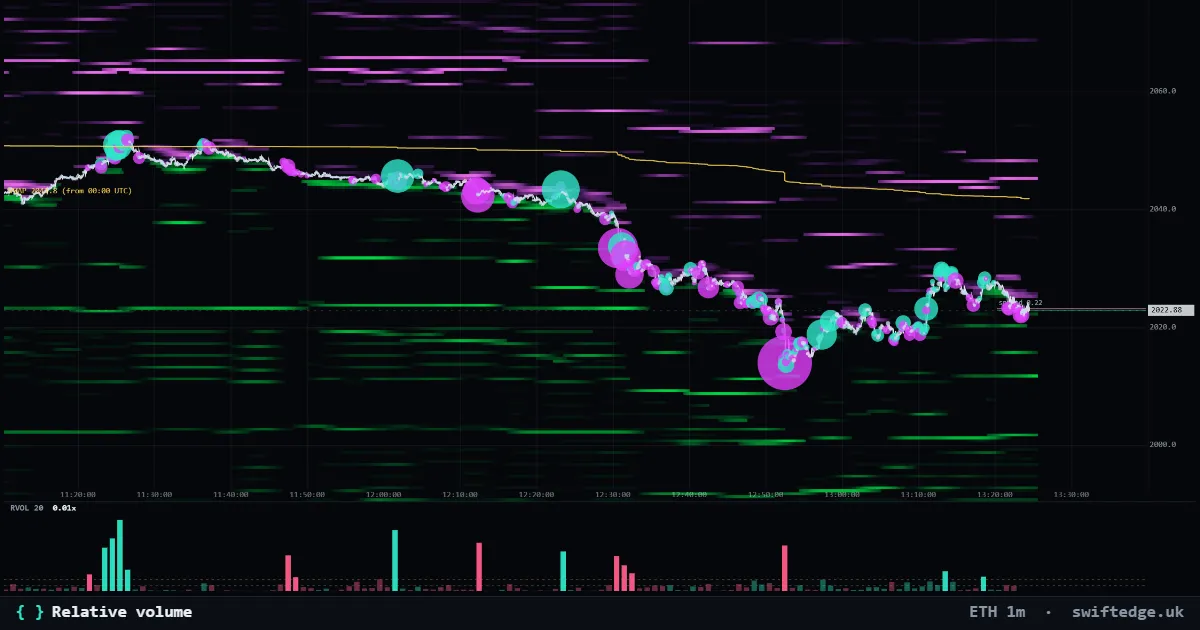
Each candle's volume against its average, colored by whether buyers or sellers were the majority.
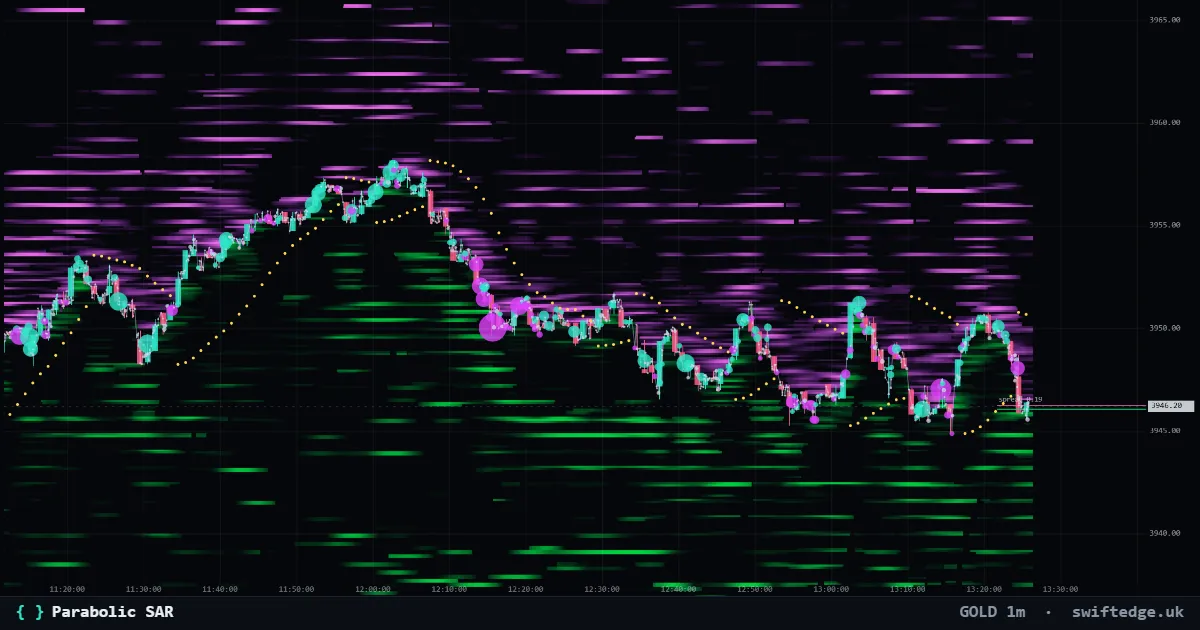
Stop-and-reverse dots that trail price and accelerate as the move continues; they flip on a break.
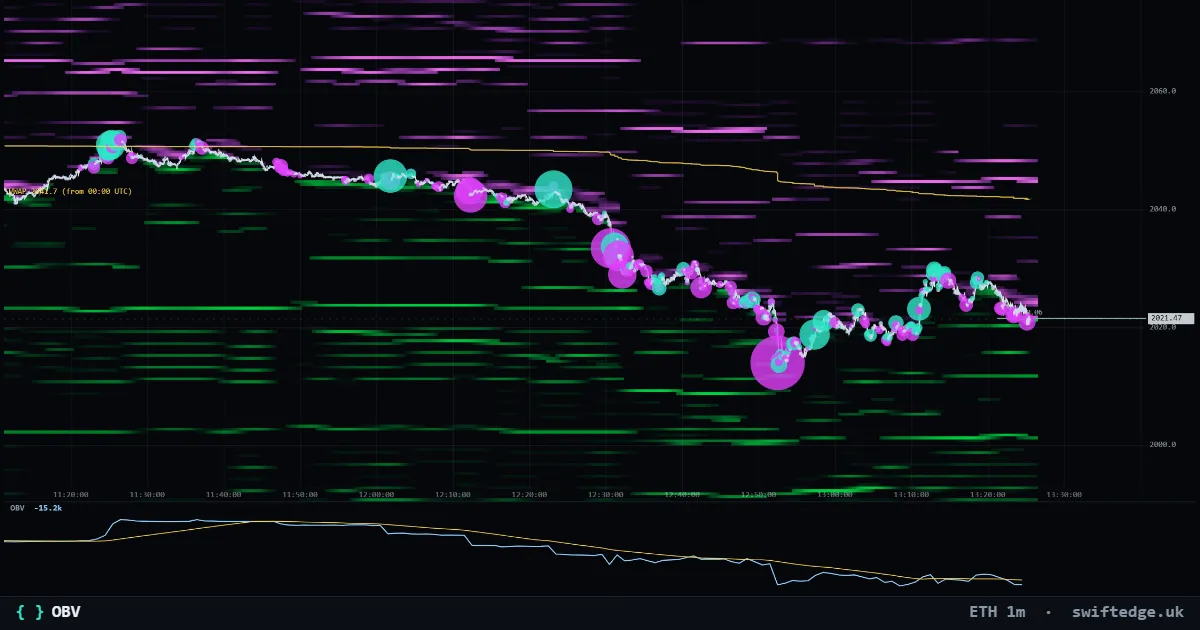
On-balance volume in a pane: volume added on up closes and subtracted on down closes.
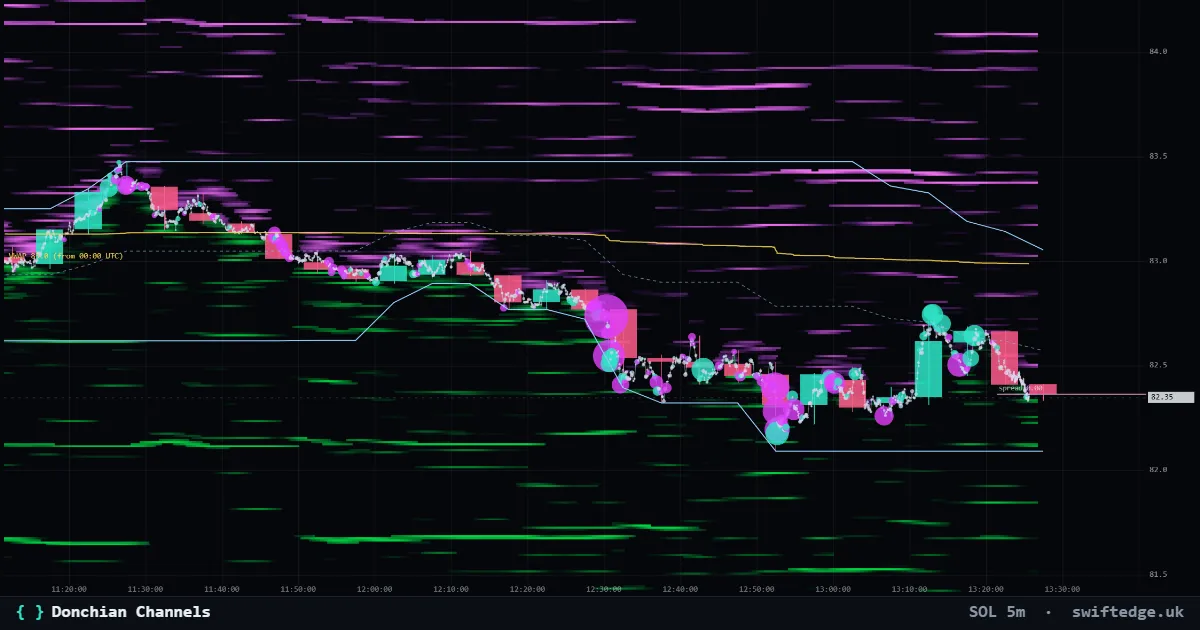
The highest high and lowest low of the last N candles, and their middle.
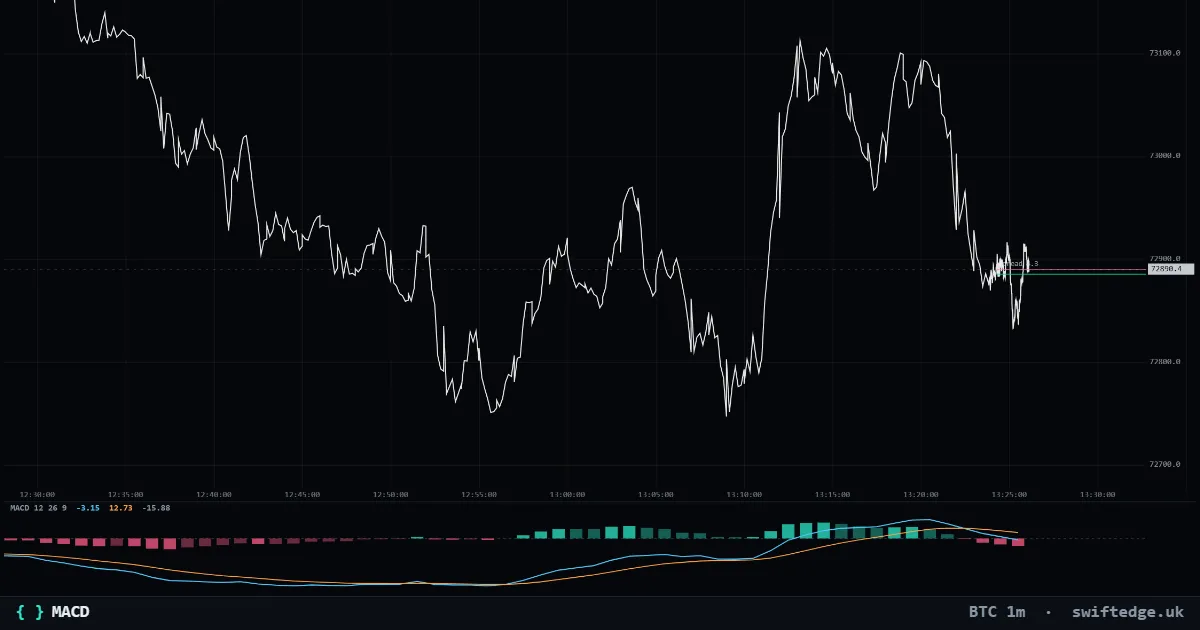
Moving average convergence divergence in a pane: the MACD line, signal line and histogram.
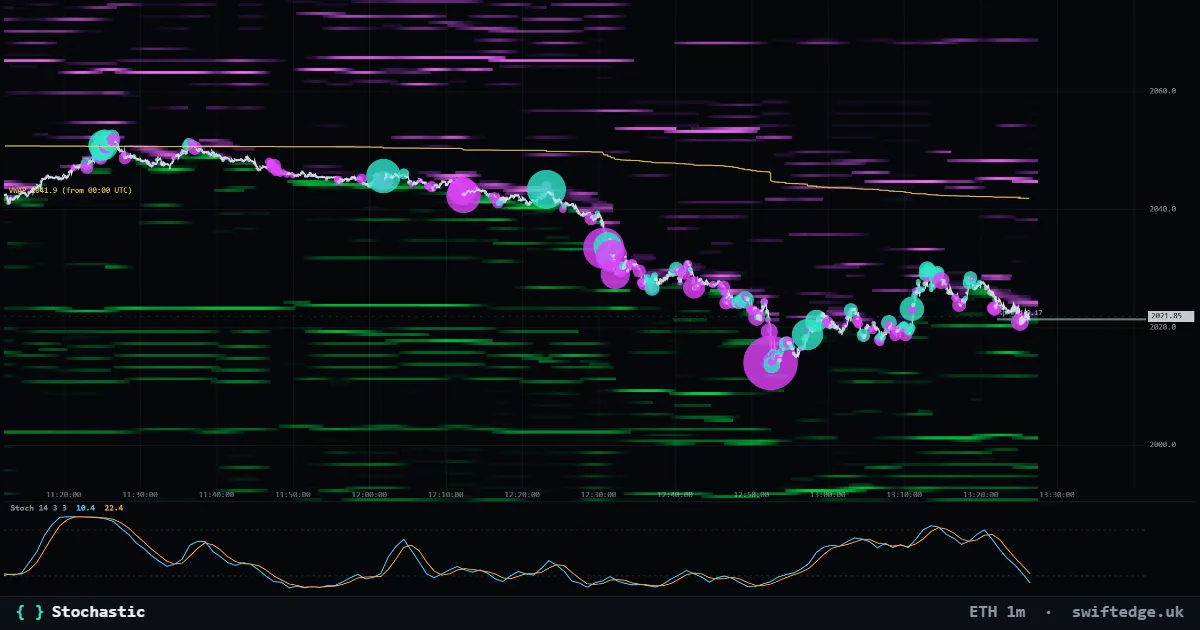
%K and %D in a pane: where the close sits within the recent high-low range (0-100).
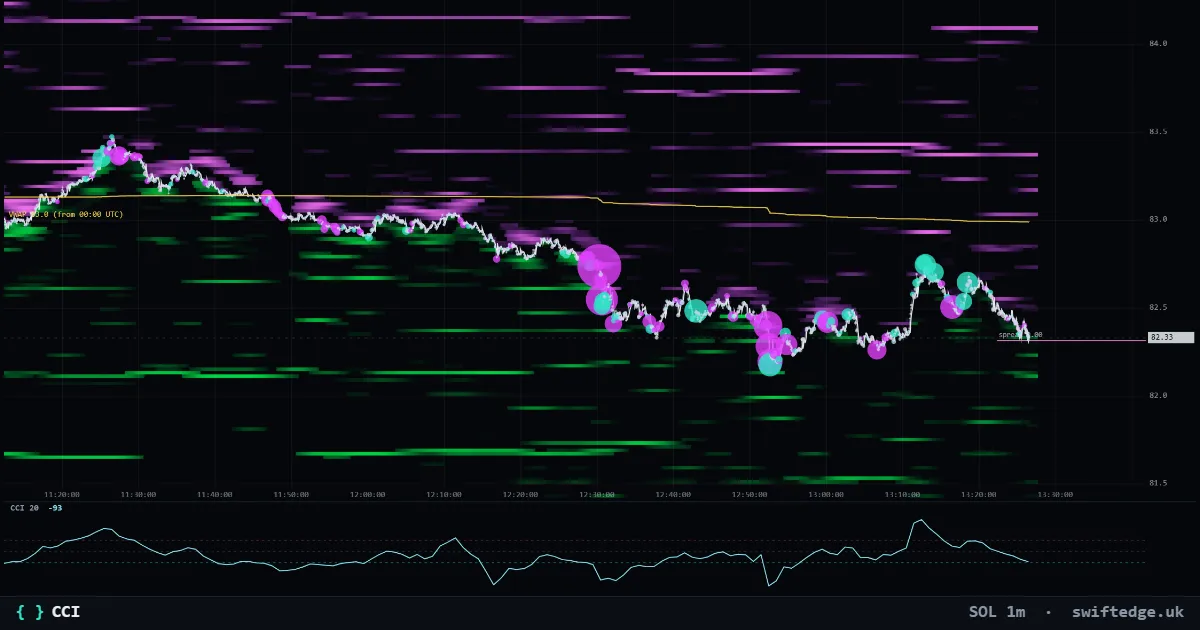
Commodity channel index in a pane: distance from the average typical price in mean deviations.
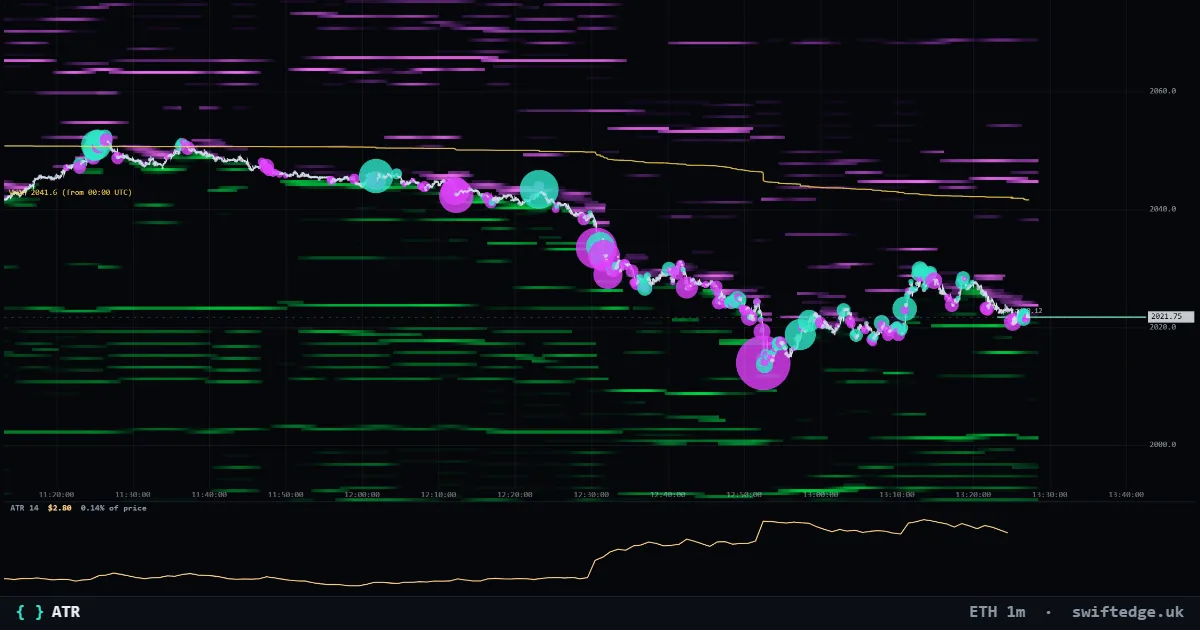
Average true range in a pane: how far price moves per candle, in dollars and as a percentage of price.
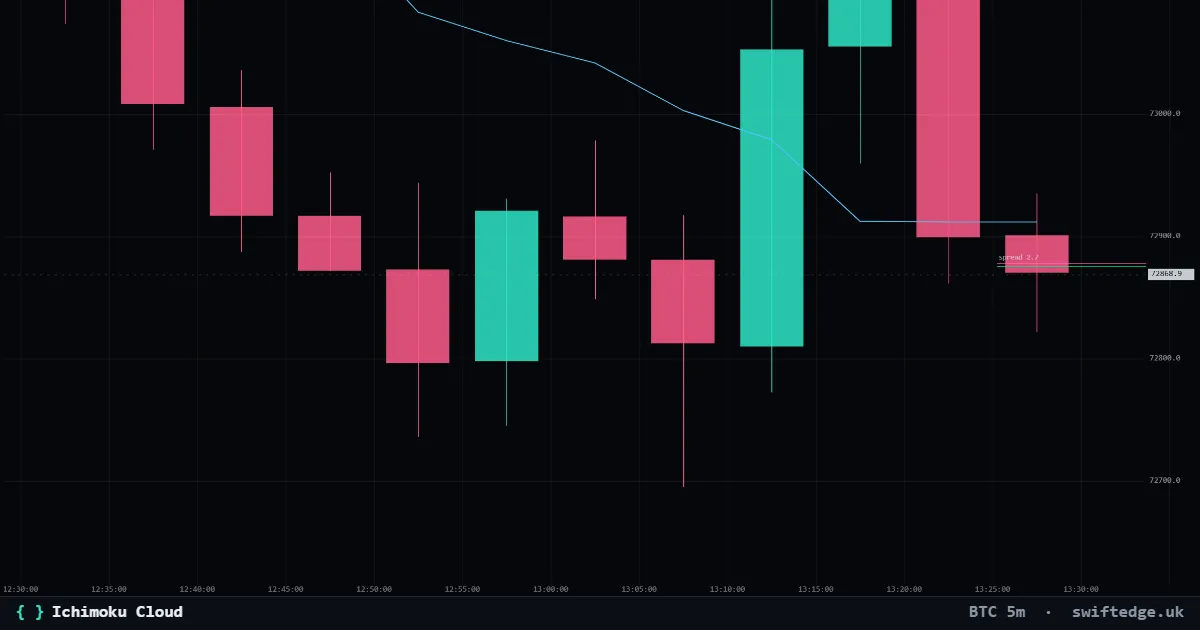
Conversion and base lines, the cloud (leading spans A and B, plotted ahead) and the lagging span.
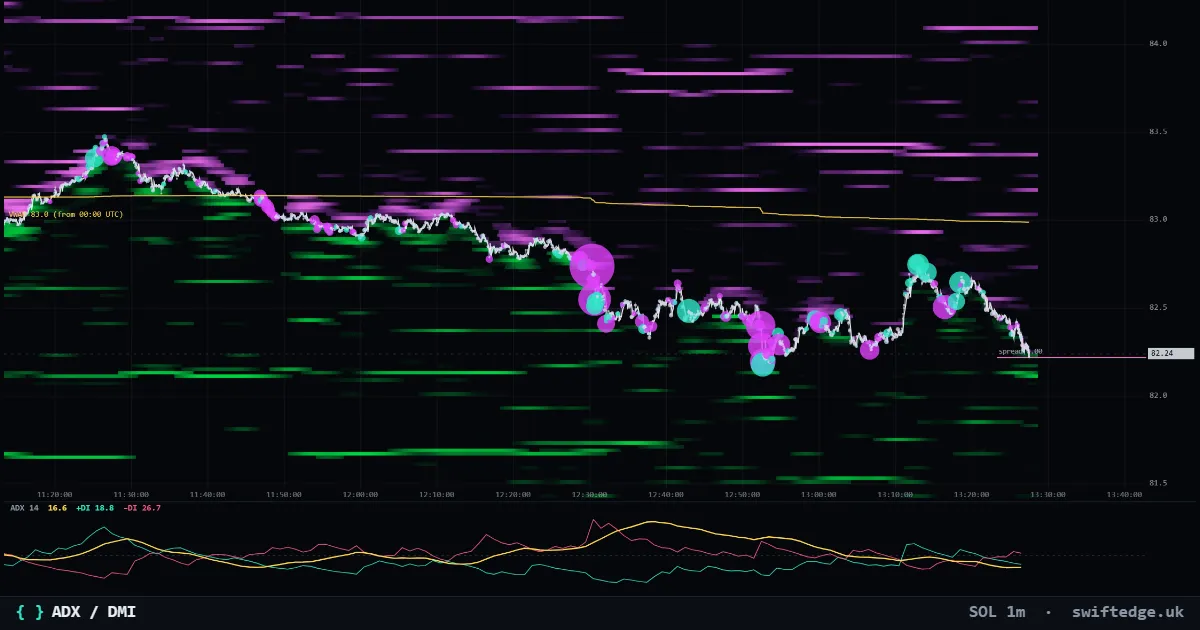
Trend strength (ADX) with the plus and minus directional lines in a pane.
Creator scripts · 1
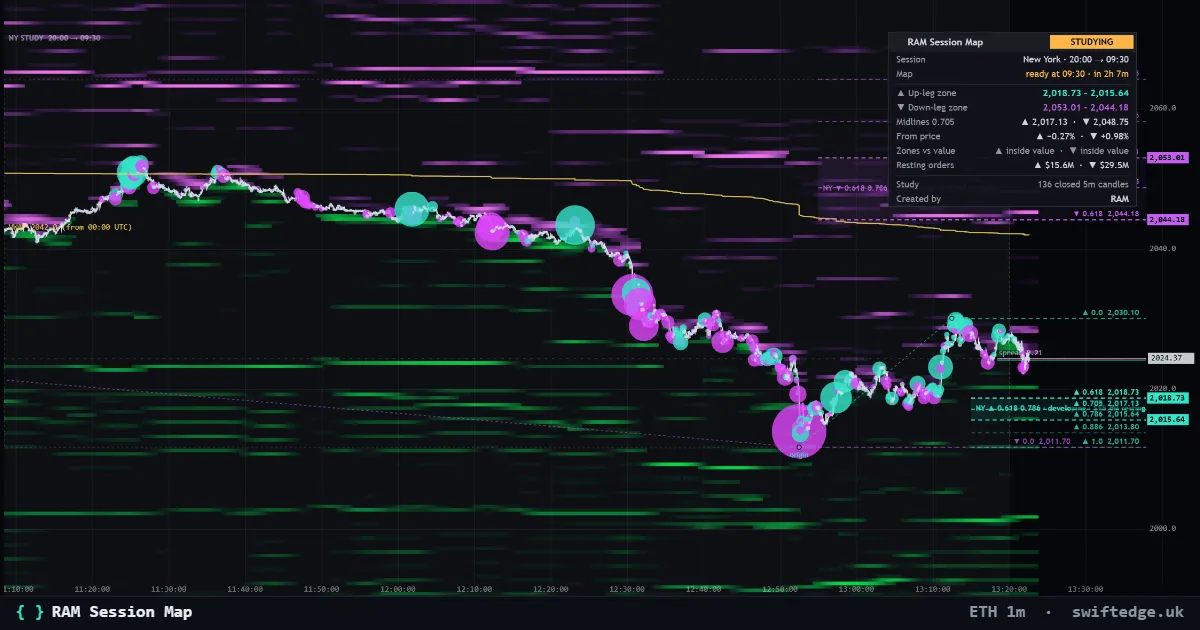
Open-source scripts copy them into your own Script Editor
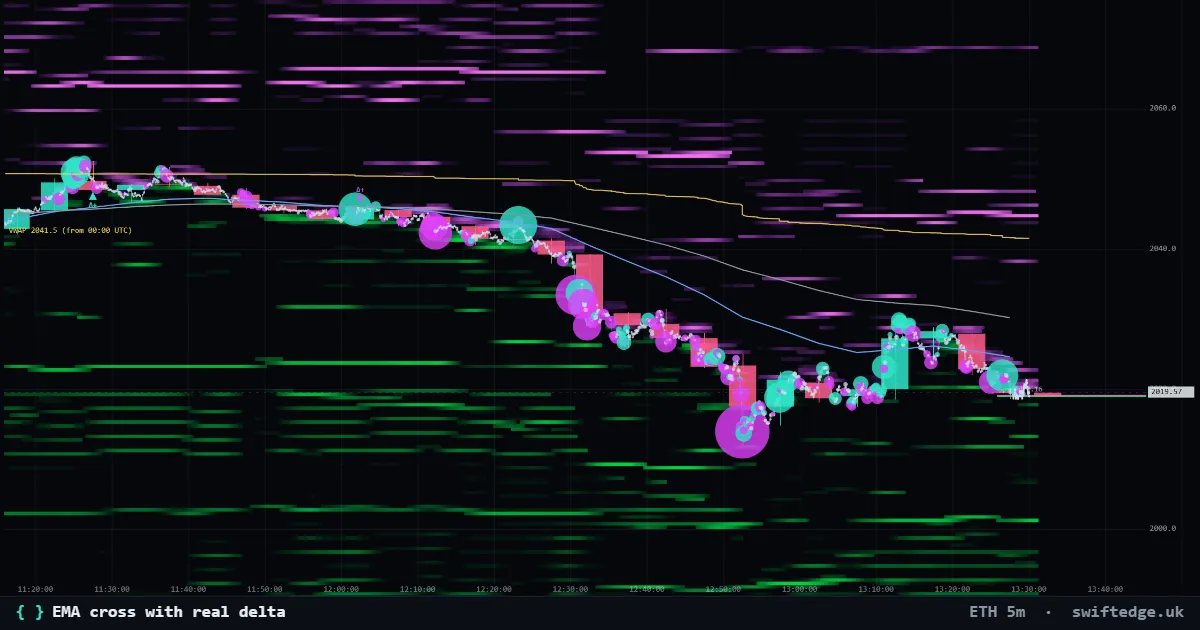
Two exponential moving averages on price, and a marker at every cross that shows whether real buying or real selling dominated the bar where the cross happened.
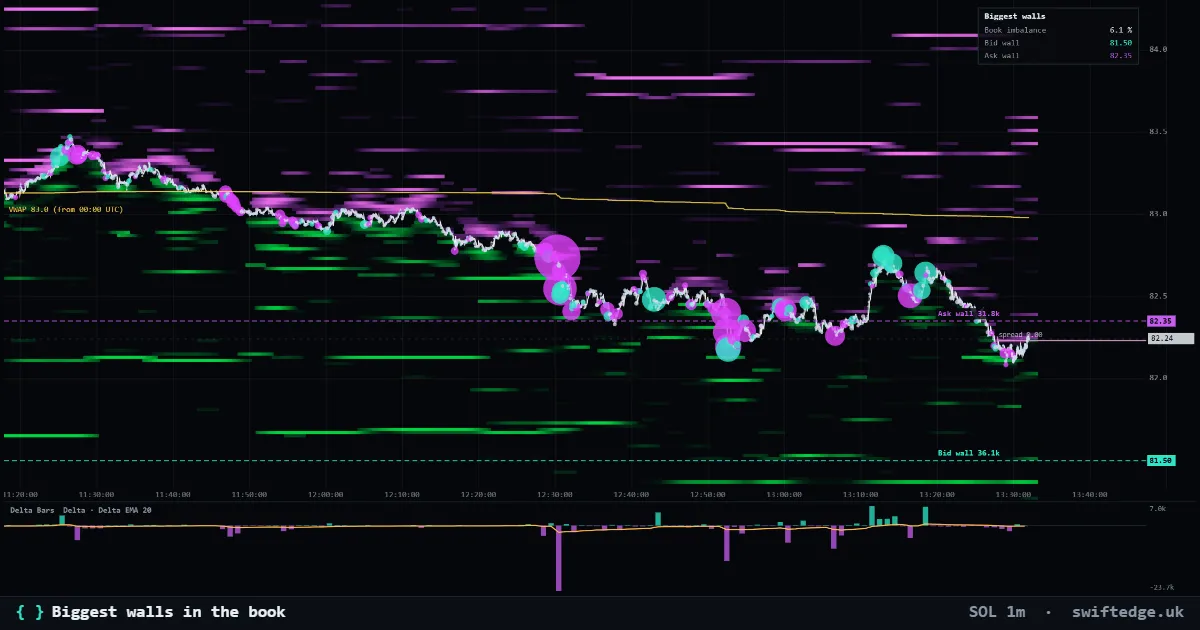
Draws the largest resting bid and ask in the live order book near the current price, with their size, and a small table with the book imbalance.
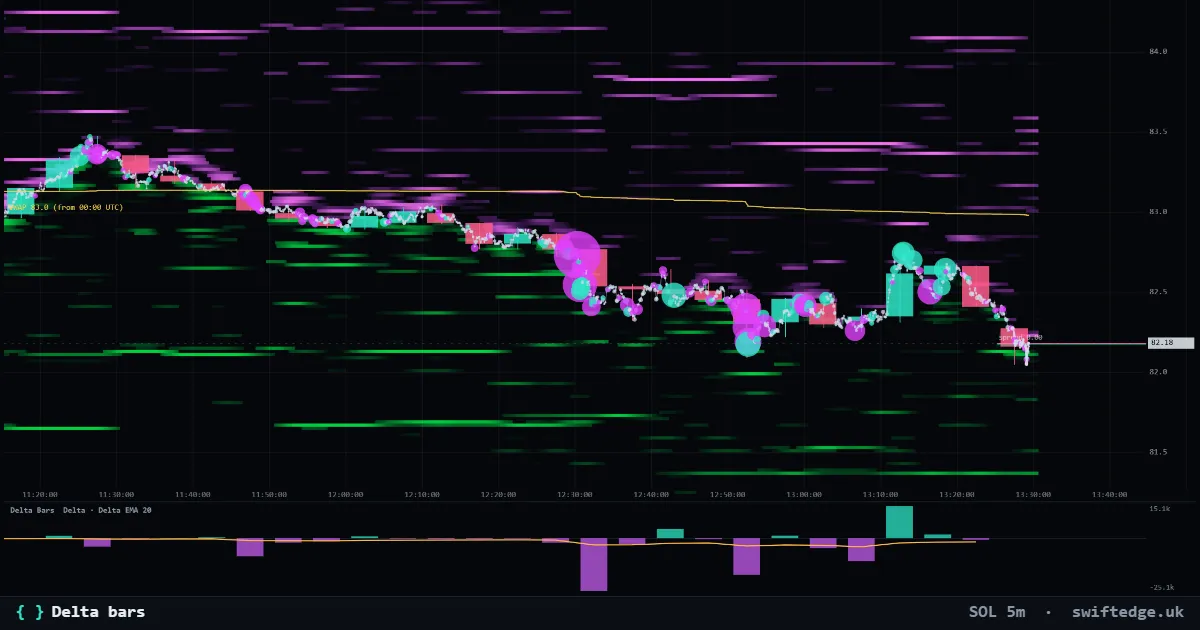
A histogram under the chart with the real delta of every bar, the taker buy volume minus the taker sell volume, plus an average of it.
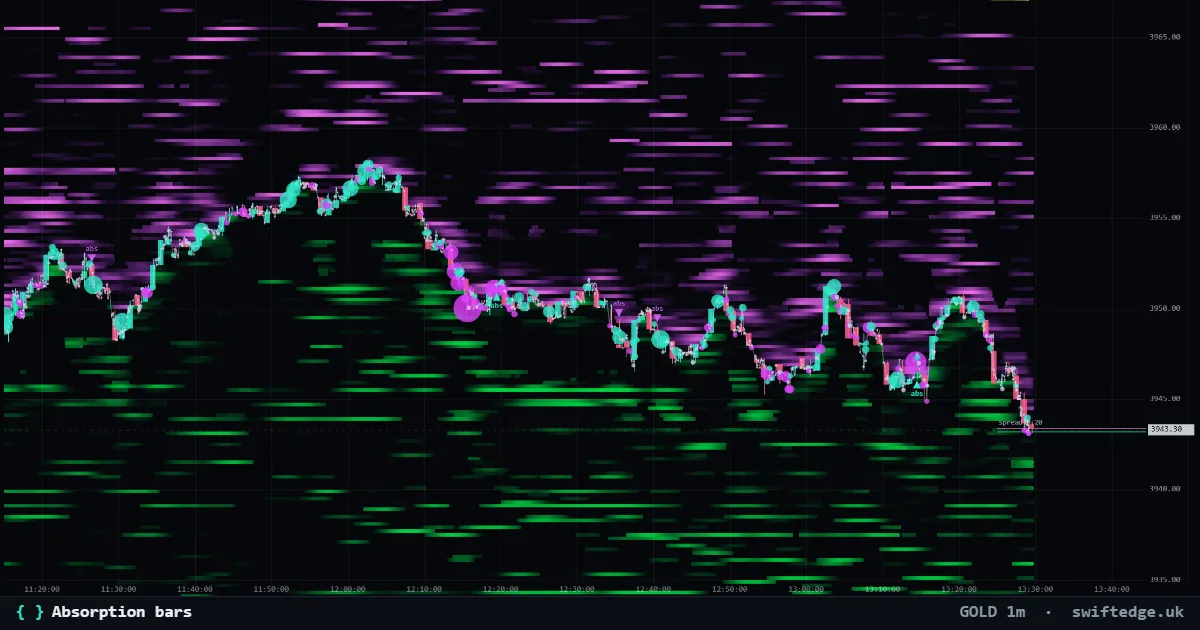
Marks bars where heavy market selling did not push price down, or heavy buying did not push it up: a sign that resting orders absorbed the aggressive side.
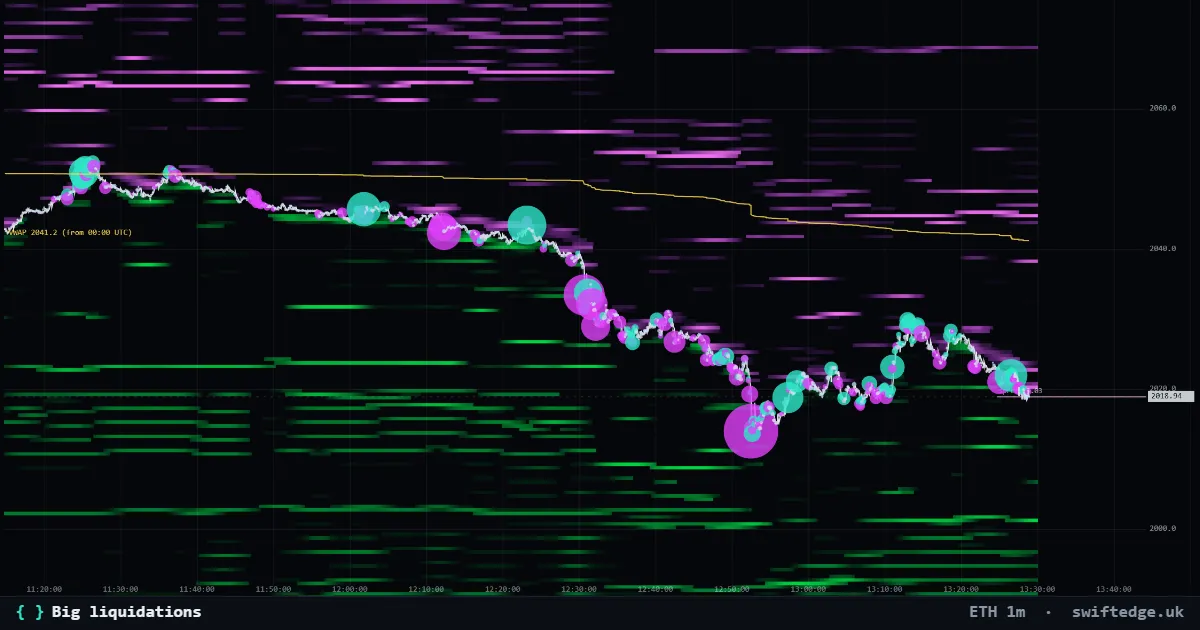
Puts a dot on the chart at the time and price of every large liquidation, colored by whether longs or shorts were closed by force.