PowerHouse SwiftEdge AI
Break-of-structure and change-of-character signals with momentum, volume and trend filters, plus a seven-timeframe trend matrix.
69K views3.5K boosts
View on TradingView
Updated 13:11 UTC · descriptive data, not advice
Levels around price
Positioning
The order book, right now
The last two minutes of the Binance SOLUSDT order book. Open Depth for the full chart: heatmap, candles or a footprint chart, whale bubbles, liquidations and GEX.
Daily report · updated hourly
Asia session: SOL fell 0.65 % (range 102–103). SOL is down 1.13 % so far today, trading between 101 and 103. The high came at 03:00 UTC and the low at 09:40 UTC.
Read the report →Weekly report
The week's range, sessions, liquidity walls and the expiries ahead.
Weekly reports →Written from the data every day: the sessions, liquidity walls that held, were pulled or eaten, and the options levels. Each finished UTC day keeps its own page.
| Day (UTC) | Close | Change | Range | Call wall | Put wall | Status |
|---|---|---|---|---|---|---|
| Sat 24 Oct 2026 | 101.6 | −1.13 % | 101 – 103 | 103 | 103 | LIVE |
Every live tool Swiftedge has for Bitcoin and Ethereum also runs on Solana, on the Binance SOLUSDT perpetual and SOL options on Deribit (USDC-settled), OKX and Bybit. Watch the SOL order book as a heatmap with every trade as a bubble, see buying and selling at every price in the footprint chart, and follow funding, open interest, liquidations and whale trades as they happen.
SOL usually moves more in percentage terms than Bitcoin, so walls, liquidation clusters and options levels sit closer to price. Deribit publishes no DVOL index for Solana, so the volatility page uses a 30-day at-the-money implied volatility calculated by Swiftedge from the SOL options.
In Swiftedge Depth for SOL: the Binance SOLUSDT perpetual book with trades, candlesticks and a footprint chart, no sign-up.
Yes. SOL options trade on Deribit, OKX and Bybit; the SOL options chain and the SOL max pain page show open interest by strike and max pain for every expiry.
The SOL liquidations page adds up every forced close on Binance, OKX and Bybit over the last 24 hours, and the liquidation heatmap estimates where the next ones could sit.
Swiftedge Depth · futures
A candle tells you where price went. Depth shows the candle too, or opens it as a footprint chart, together with the orders that pushed it there, the walls it stopped at, and the size that got absorbed along the way, on the BTCUSDT, ETHUSDT and SOLUSDT perpetuals from Binance.
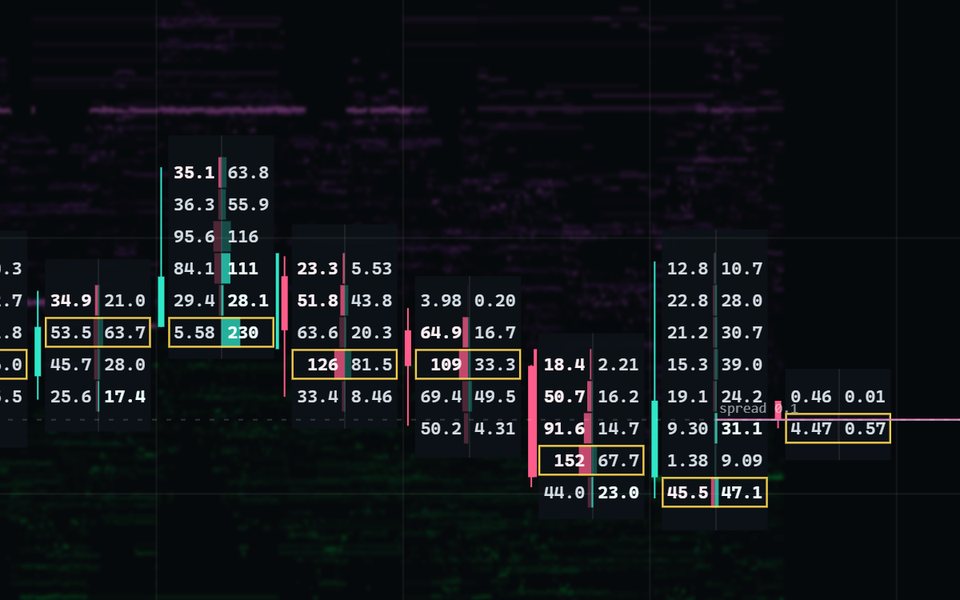
Every candle opened up: volume sold into the bid and bought from the ask at each price, diagonal imbalances, the point of control and delta. How to read it
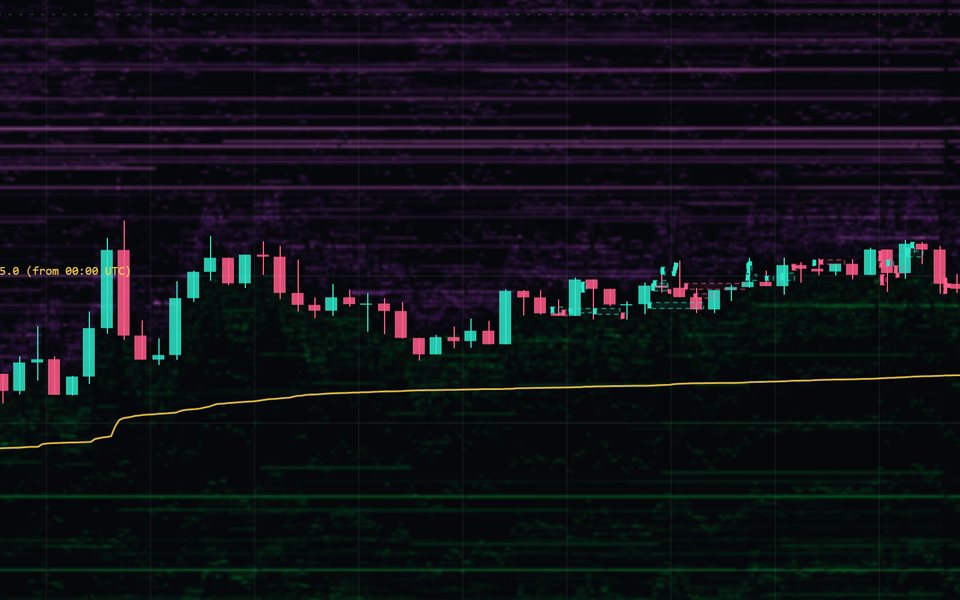
Open, high, low and close from every trade, from 1 second to 4 hours, drawn over the live heatmap. Switch between line, candles and footprint in the top bar.
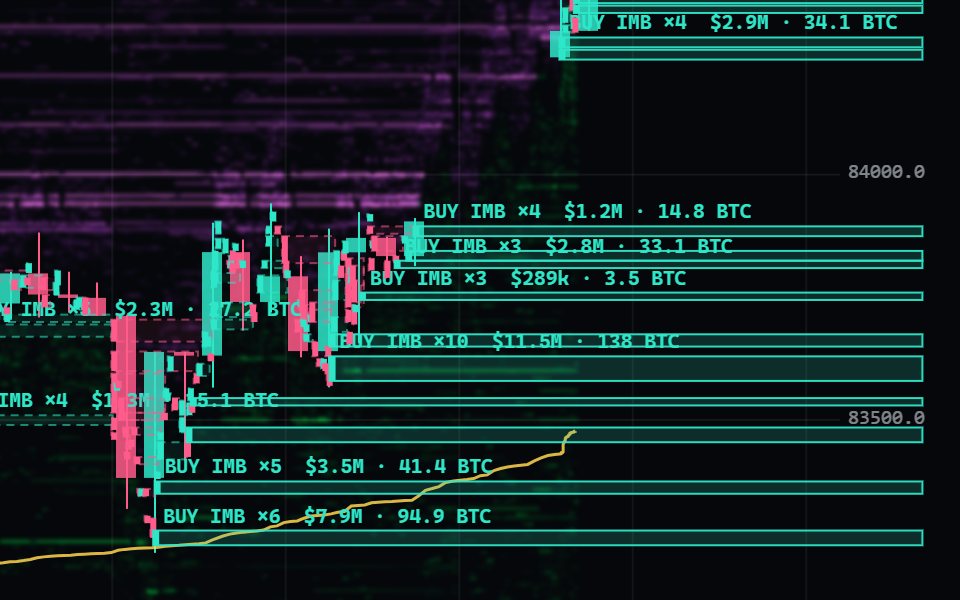
Stacked imbalance zones that run until price trades through them, and a readout of order book and aggressive volume imbalance. How long zones hold
Resting orders out to 2 % from price, painted by size, so walls and gaps stand out at a glance.
Every print, sized by volume and coloured by who crossed the spread. Large executions light up across the chart.
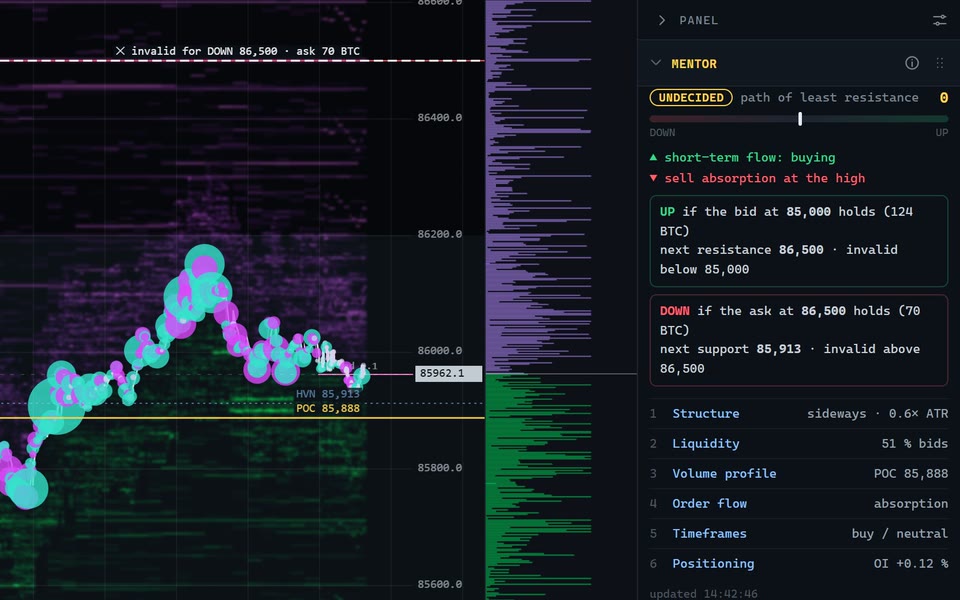
A seven-step read of structure, liquidity, volume profile, order flow, timeframes and positioning, with the level that invalidates it.
Opening ranges for Tokyo, London and New York with relative volume, breakout bands, day type and historical hit rates.
Trend lines, Fibonacci, channels, shapes, text and long/short positions, saved in your browser, pinned to price and time.
Scroll back through at least the last 24 hours (older hours load as you scroll) and zoom all the way in to the raw book, at the same precision as live.
Open Depth New to heatmaps? How to read a Bitcoin order book heatmap
Swiftedge Options · new
Swiftedge Options lays out the BTC options on Deribit, OKX and Bybit as one live chain, one row per strike, with the futures order book running through the middle. It shows where the money is positioned and what traded today. It describes; it does not forecast.

Strikes run top to bottom, centred on the live BTC price. Calls grow to the left, puts to the right. Expiry tabs switch between daily, weekly, monthly and quarterly expiries, or show all of them at once.
Taller rows are where today's option prices imply BTC is more likely to settle at the selected expiry: options-implied (risk-neutral) odds, not a forecast. Brackets mark the ±1σ expected move.
Bar length is open interest. Bar colour shows who was aggressive at that strike today, read from the taker side: teal when buyers dominated, violet when sellers did, a muted neutral when balanced. A thin white line inside the bar is today's traded volume.
Rows glow where estimated dealer hedging leans against moves (blue) or with them (pink). Tags mark the call wall, put wall, gamma flip and max pain. Dealer positioning is estimated.
A mini Swiftedge Depth for the BTCUSDT perpetual: price trail, the biggest futures walls and futures trades, with its own zoom. LINK lines the live price up with the chain.
Option trades fly in and merge into their strike (white ring = block trade). The bottom strip sums the last hour of options premium. An optional Dealer desk (est.) indicator adds a hedge column.
What the chain is, and is not. Row height shows options-implied (risk-neutral) odds: what options cost, not a forecast. Dealer positions are not public, so gamma, walls and the flip are estimated under the standard assumption that dealers are long calls and short puts. Buy and sell are read from the taker side of each trade. Descriptive only, not advice.
Open Options Step by step: How to read the Swiftedge options chain
Swiftedge Terminal · new
Swiftedge Terminal puts the whole Bitcoin, Ethereum or Solana market in one window: a price chart you can zoom from one minute to years and draw on, the order book ladder, time and sales, liquidations, funding and open interest, options levels, crypto news and a market calendar. Keyboard first, built on the same live data as Depth and Options.
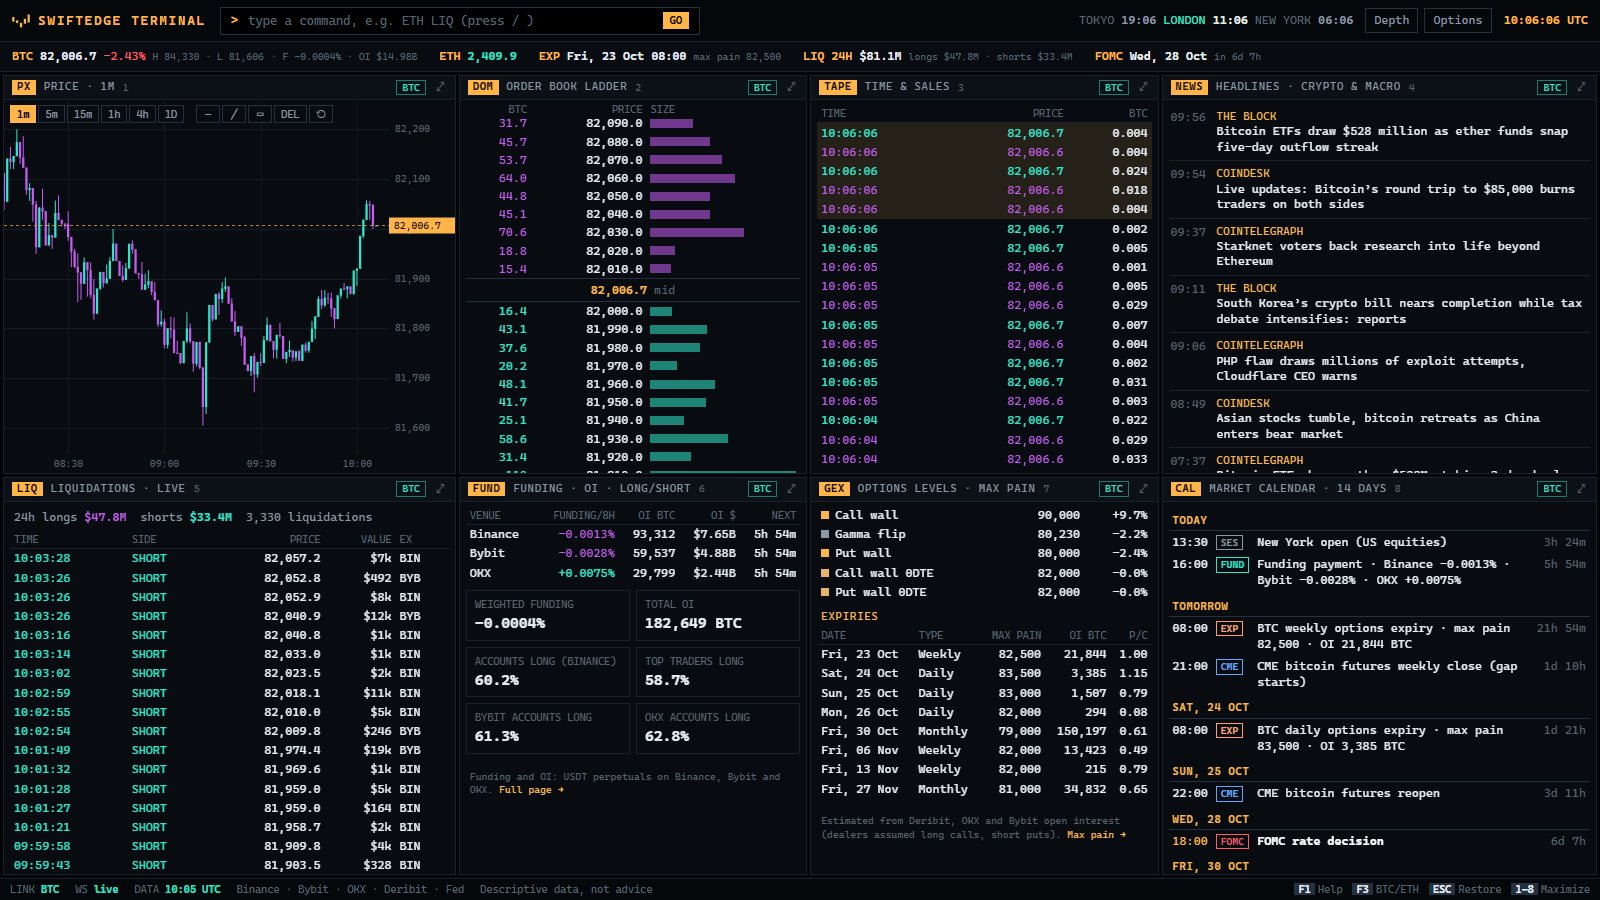
Candles from 1 minute to 1 day. Scroll to zoom, drag to go back in time, and draw horizontal lines, trend lines and boxes. The options call wall, put wall and gamma flip are drawn on the chart.
The order book ladder around price and time and sales, live from the same feed as Depth. Large trades are highlighted.
Real forced closes on Binance, OKX and Bybit as they happen, with the 24-hour total for longs and shorts.
Funding rate, open interest and the long/short ratio by exchange, with the time to the next funding payment.
Call wall, put wall, gamma flip, max pain and the next expiries with open interest and put/call ratio. Dealer positioning is estimated.
Crypto and macro headlines, and a 14-day calendar with options expiries, FOMC, US CPI and jobs reports, funding times and CME hours, with countdowns.
Open the Terminal Same data, more depth: Swiftedge Depth and Swiftedge Options
GEX levels
Gamma exposure (GEX) estimates how much options dealers would buy or sell to stay hedged as BTC moves. Swiftedge turns it into a few levels traders already talk about, from BTC options on Deribit, OKX and Bybit.
Add the GEX indicator to draw the gamma flip, call wall and put wall on the live heatmap, with 0DTE options shown apart from later expiries.
The chain glows blue or pink by estimated dealer gamma, with tags for the call wall, put wall, flip and max pain at the selected expiry.
Each day's call wall, put wall, gamma flip and the next expiries, next to how the sessions traded.
Dealer positioning is estimated, not measured. Guides: What is GEX? · Gamma flip · Call wall and put wall · Dealer hedging · Max pain
Daily BTC report
A report written from the same live data, updated hourly. Each finished day keeps its own page, so you can look back at how a level behaved.
For TradingView
The same ideas, on your own charts. Published on TradingView, built for crypto, forex, indices and futures.
Break-of-structure and change-of-character signals with momentum, volume and trend filters, plus a seven-timeframe trend matrix.
Trend pullbacks made visible: signals fire when price retraces into the 12/21 EMA zone on the right side of VWAP and a strong candle closes back out, each with a confidence score.
A Nadaraya-Watson envelope scaled by ATR marks dynamic support and resistance, with RSI confirming overbought and oversold touches before a signal is shown.
Swing highs and lows become a heatmap of likely liquidity: buy-side pools below price, sell-side above, each marked with a bubble sized by the volume behind it.
Trend-following with ICT structure: high/low SMAs define the trend, and signals fire only when price breaks a higher-timeframe BOS or MSS level in the same direction.
Swing pivots with the optimal-trade-entry zone (0.618–0.786), a trend filter and Fibonacci extension targets.
See all 41 scripts on TradingView Figures from TradingView, October 2026
Learn
Plain-language guides to what Depth and Options show, and a glossary of order flow and options terms.
Rows, row height, bar colours, gamma zones and the futures spine in Swiftedge Options, step by step with annotated screenshots.
Read the guideWhat the live BTC heatmap shows, why it matters and how to read it step by step: walls that hold, get eaten or get pulled.
Read the overviewThe three layers of the chart, the patterns that come up again and again, and how to read the colour scale honestly.
Read the guideWho is waiting and who is in a hurry, what absorption looks like in the book, and why delta alone can mislead.
Read the guideReal walls versus pulled ones, why round numbers attract size, and what usually happens when price arrives.
Read the guideEvery large wall in four weeks of the Bitcoin order book, classified as held, eaten or pulled from the trades at its own price.
Read the guideCumulative volume delta, how Depth builds it, and what 24,528 hours of BTC trades show about it.
Read the guideThe expiry calendar, how the settlement price is set, and two years of data on the half hour before it.
Read the guideEstimated liquidation levels versus orders that actually rest in the book, and what our data shows about bright bands.
Read the guideOrder flow and options glossary Options levels: five guides to GEX, starting with what it is.
FAQ
Swiftedge is a Danish company, Swiftedge ApS, that builds free order flow tools for Bitcoin, Ethereum and Solana traders: Swiftedge Depth, a live futures order book heatmap with candlesticks and a footprint chart, Swiftedge Options, a live BTC options chain, and Swiftedge Terminal, every live panel on one screen, all in the browser. Swiftedge also publishes a daily BTC market structure report and the SwiftEdge indicators on TradingView.
Swiftedge Depth is a free, browser-based order flow tool for Bitcoin, Ethereum and Solana. It shows the live BTCUSDT, ETHUSDT and SOLUSDT futures order book as a heatmap, draws every trade as a bubble sized by volume, shows price as a line, candlesticks or a footprint chart, and adds stacked imbalance zones, a built-in market read (Mentor), session levels (Session Orbs), options gamma exposure (GEX) levels, CVD and 24 drawing tools, with price and wall alerts. It updates four times a second and needs no download or account.
Swiftedge Options is a free live Bitcoin options chain for BTC options on Deribit, OKX and Bybit. Strikes are rows, calls on the left and puts on the right. Bars show open interest, coloured by which side was aggressive today, live trades fly in, estimated dealer levels mark the call wall, put wall, gamma flip and max pain, and a futures spine in the middle shows a mini Depth of the BTCUSDT perpetual. How to read it.
Swiftedge Terminal is a free, keyboard-first trading terminal for Bitcoin, Ethereum and Solana in the browser. One screen shows a price chart from 1 minute to 1 day with zoom and drawing tools, the order book ladder, time and sales, liquidations, funding and open interest by exchange, options levels and max pain, crypto news and a market calendar with options expiries and FOMC meetings. Click any price to mark it on the chart, or type a command such as ETH LIQ. Open the Terminal.
Row height shows the options-implied (risk-neutral) odds that BTC settles near each strike at the selected expiry, derived from today's option prices and the implied volatility smile. Taller rows are where options price the most likely outcomes. It describes what options cost; it is not a forecast.
No, they are estimates. Open interest shows how many options exist, not who holds them, and dealer positions are not public. The levels use the standard assumption that dealers are long calls and short puts, so treat them as estimated positioning, not measured fact.
Yes. Both apps have price alerts with sound and browser notifications; Depth adds large-wall alerts, Options alerts near the call wall, put wall and gamma flip. Share turns any moment in Depth, or any strike in Options, into an image card with a link for X, Facebook, Reddit, Telegram, Instagram and more. A live chat runs alongside both.
Yes. Depth, Options and the Terminal are free and need no sign-up. Depth is in public beta; a paid Premium plan with extra features is planned for later, and a free version will stay available.
Swiftedge Depth is a free Bookmap-style order book heatmap for Bitcoin that runs in the browser with no account and no download. It covers BTCUSDT perpetual futures on Binance only; platforms such as Bookmap cover many more markets and exchanges. What Depth does and does not do.
Depth shows Bitcoin, Ethereum and Solana perpetual futures (BTCUSDT, ETHUSDT and SOLUSDT) from Binance USDⓈ-M futures: the order book out to about 2 % from price, every trade, and at least the last 24 hours of history. Options and the GEX levels use BTC, ETH and SOL options data from Deribit, OKX and Bybit.
Yes. Everything that exists for Bitcoin also exists for Ethereum: the ETH order book heatmap with liquidations, Mentor, Session Orbs and GEX, the ETH options chain, the daily and weekly ETH reports, ETH levels, ETH liquidations and the ETH liquidation heatmap. Switch coin in the top bar of Depth or Options.
Yes. Every Bitcoin and Ethereum tool also exists for Solana: the SOL order book heatmap with candlesticks, a footprint chart and liquidations, the SOL options chain (Deribit, OKX and Bybit), the Terminal, the daily and weekly SOL reports, SOL levels, liquidations, the liquidation heatmap, funding, GEX and max pain. Deribit publishes no DVOL index for Solana, so the SOL volatility page uses a 30-day at-the-money implied volatility calculated by Swiftedge.
No. Swiftedge shows market data and descriptive analysis for information and education. It does not give buy or sell recommendations or forecasts, and trading involves substantial risk of loss.
All questions and answers More in the glossary and on the about page.
Free · no account