Community scripts › Built into Depth › Executions
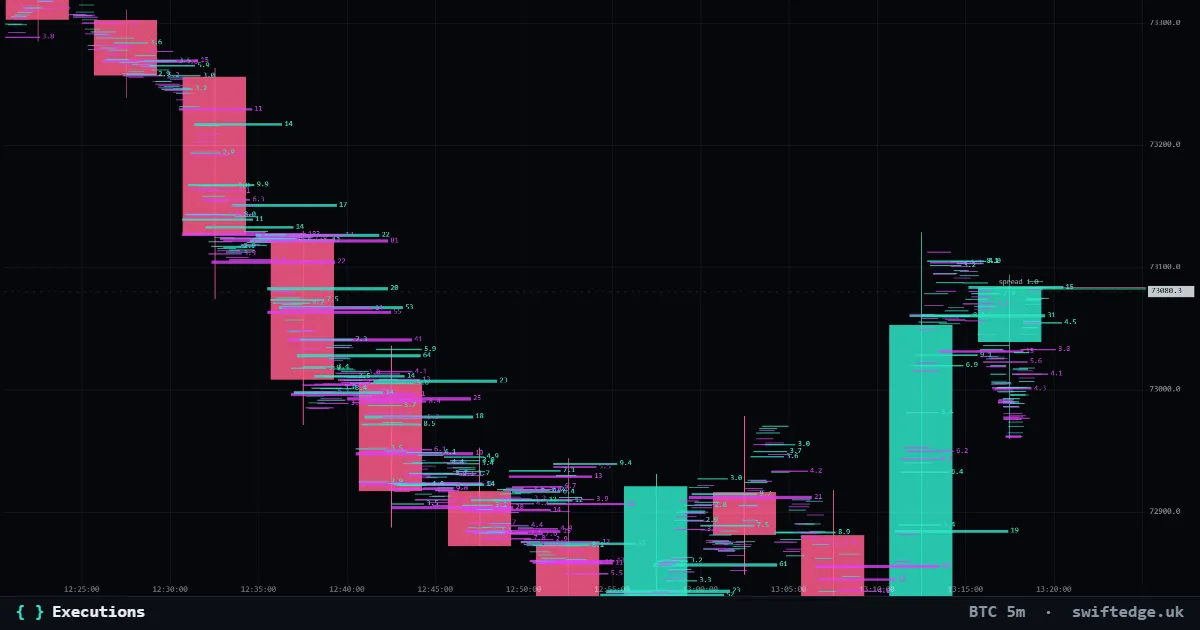
What it shows
Lasers across the chart for unusually large trades, so they stay visible when you zoom out.
How to read it
Large single trades are drawn as horizontal lasers at their price, so you can see later where size traded.
How it's calculated
Depth draws a horizontal laser at the price of every unusually large trade, so the trade stays visible when you zoom out and the bubble becomes too small to see. The table counts trades of the market's large-trade size or more over the last 24 hours, split into aggressive buys and sells.
What it can't tell you
One large trade can be one participant or many orders matched at once. Size says urgency, not direction for the rest of the day.
Executions on 9 markets right now
| Market | Price | Large trades (24 h) | Reading | |
|---|---|---|---|---|
| Bitcoin | 72,070 | Bought $185.9M · Sold $221.8M | Large sells outweighed large buys (101 buys, 113 sells of $1.0M or more) | Open chart › |
| Gold | 3,899.33 | Bought $19.0M · Sold $26.8M | Large sells outweighed large buys (77 buys, 103 sells of $100k or more) | Open chart › |
| Ethereum | 2,012 | Bought $187.7M · Sold $136.9M | Large buys outweighed large sells (192 buys, 130 sells of $500k or more) | Open chart › |
| Solana | 81.47 | Bought $10.2M · Sold $19.6M | Large sells outweighed large buys (23 buys, 32 sells of $250k or more) | Open chart › |
| XRP | 1.0303 | Bought $8.1M · Sold $9.4M | Large sells outweighed large buys (97 buys, 84 sells of $50k or more) | Open chart › |
| US 500 | 7,590.40 | Bought $91.7M · Sold $68.6M | Large buys outweighed large sells (345 buys, 256 sells of $100k or more) | Open chart › |
| US 100 | 28,241.2 | Bought $73.5M · Sold $71.3M | Large buys outweighed large sells (128 buys, 133 sells of $200k or more) | Open chart › |
| Silver | 50.451 | Bought $15.4M · Sold $15.8M | Large sells outweighed large buys (127 buys, 162 sells of $50k or more) | Open chart › |
| WTI crude oil | 85.39 | Bought $14.4M · Sold $9.5M | Large buys outweighed large sells (31 buys, 25 sells of $200k or more) | Open chart › |
FAQ
What counts as a large trade?
In the table, a trade of at least the minimum shown, which is set per market: larger markets have a higher threshold.
Why lasers instead of bubbles?
Bubbles shrink when you zoom out. A laser keeps the price of a large trade visible across the whole chart.
Are large buys more important than many small ones?
Not necessarily. Delta and CVD add up all the aggressive volume; Executions only highlights the big prints.
More in Order flow
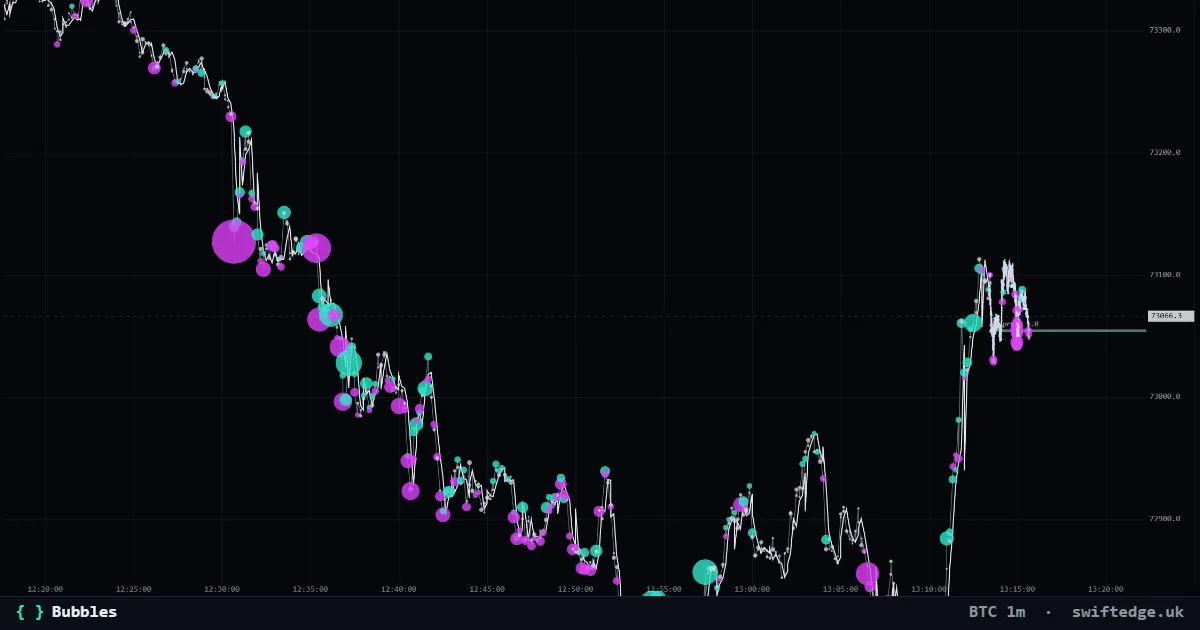
Every trade as a bubble: teal for aggressive buys, violet for aggressive sells; the size is the volume.
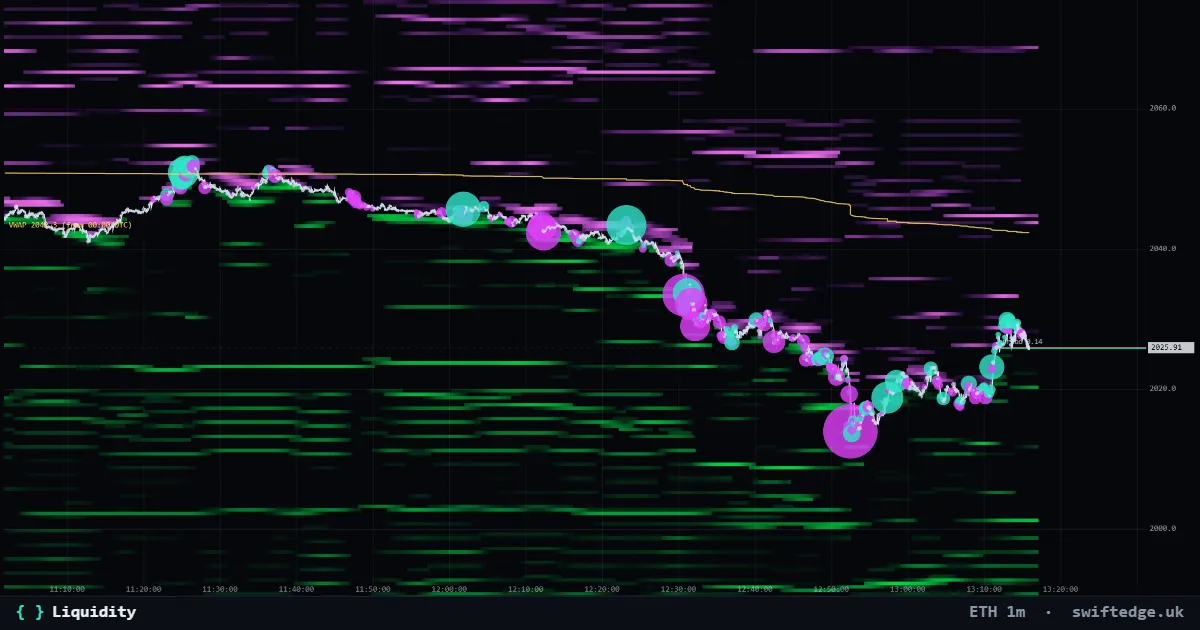
Resting limit orders in the order book by price and time: green bids below price, violet asks above. Brighter means more size.
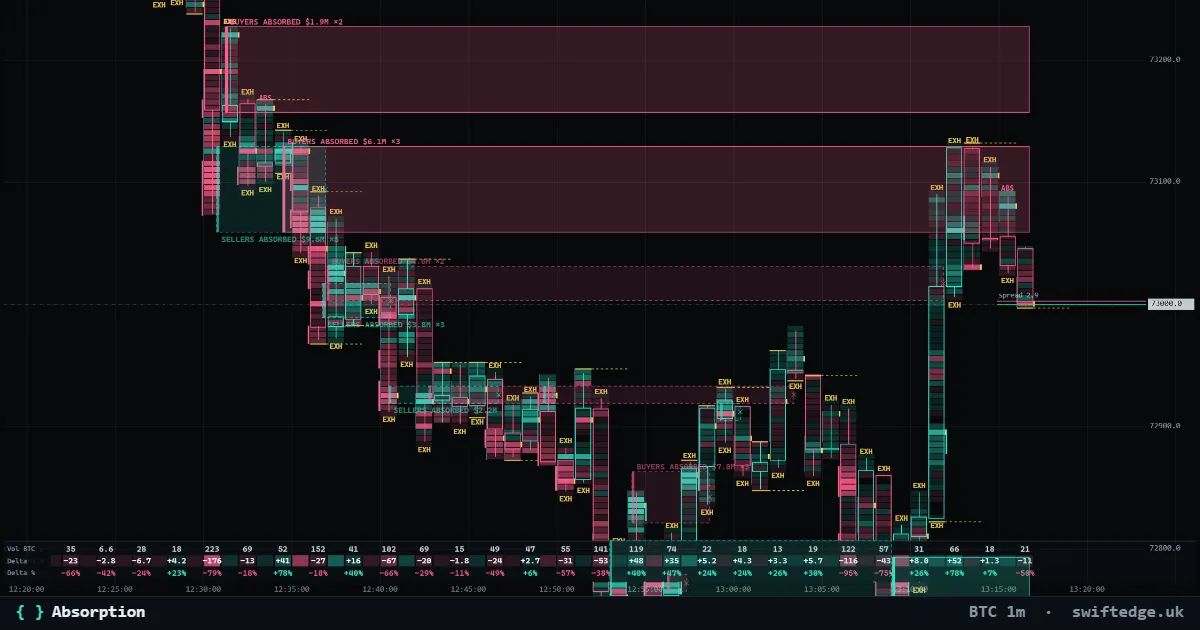
Zones where heavy aggressive selling (or buying) hit a price level and price did not get through; the zone runs until price trades past it.