Community scripts › Built into Depth › Bubbles
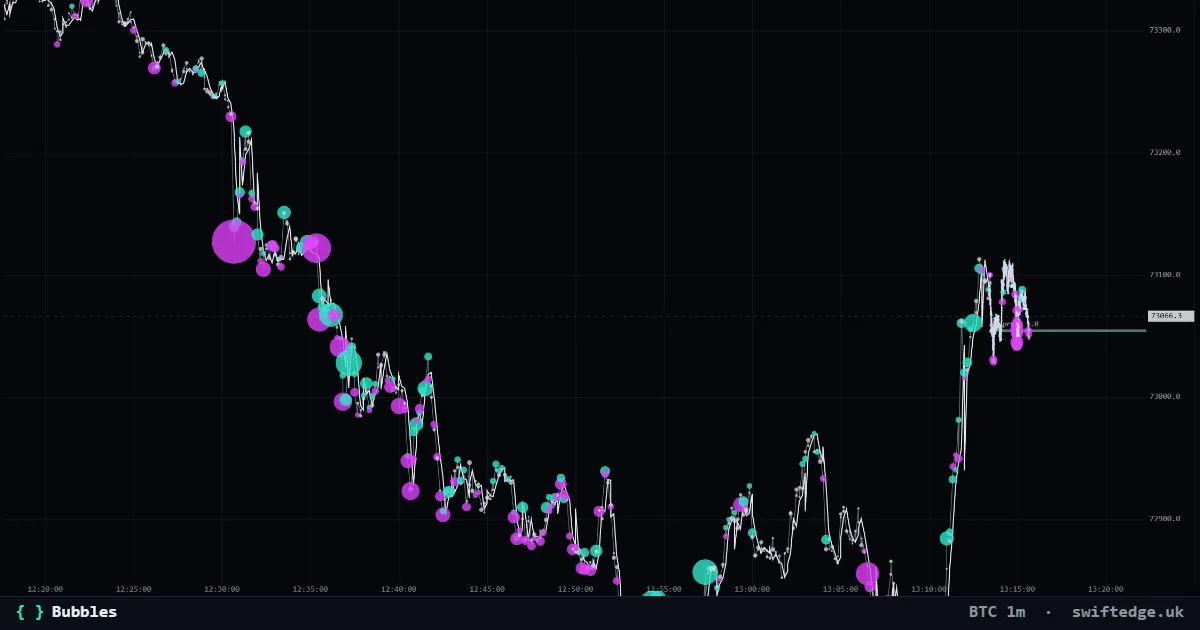
Every aggressive trade, sized by volume. Put it on top of Liquidity to see who hits the walls and whether the walls hold.
What it shows
Every trade as a bubble: teal for aggressive buys, violet for aggressive sells; the size is the volume.
How to read it
A trade happens when someone crosses the spread. The aggressive side (the taker) decides the color. Clusters of large bubbles show where urgency was; large bubbles against a wall that holds are absorption.
How it's calculated
Every trade is drawn as a bubble at its price and time. The aggressive side decides the color: teal when a buyer crossed the spread, violet when a seller did. The size grows with the volume, so a cluster of large bubbles shows where trading was urgent.
What it can't tell you
A bubble shows who was aggressive, not who was right. Large aggressive trades into a wall that holds often end up on the losing side of the move.
FAQ
What does aggressive mean?
The trader who crossed the spread with a market order, buying at the ask or selling at the bid. The other side was resting in the book.
Why combine Bubbles with Liquidity?
Together they show whether aggressive trades hit a wall and whether the wall held, which is what absorption looks like.
Can I change how big the bubbles are?
Yes. The size scale can follow the trades on screen or the last 24 hours.
More in Order flow
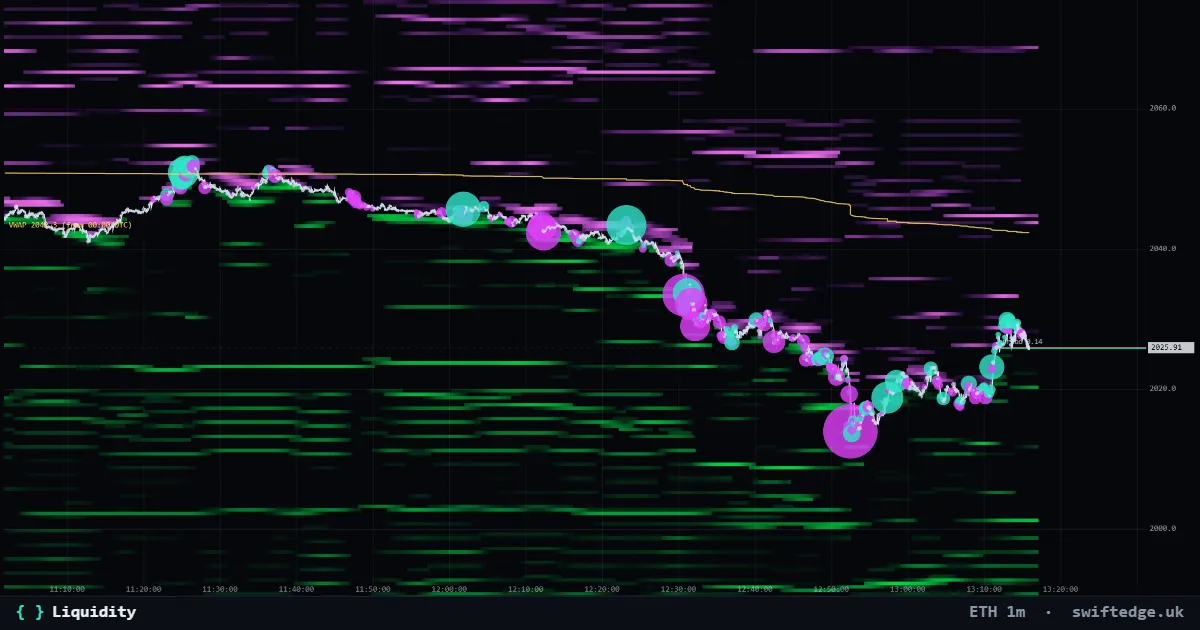
Resting limit orders in the order book by price and time: green bids below price, violet asks above. Brighter means more size.
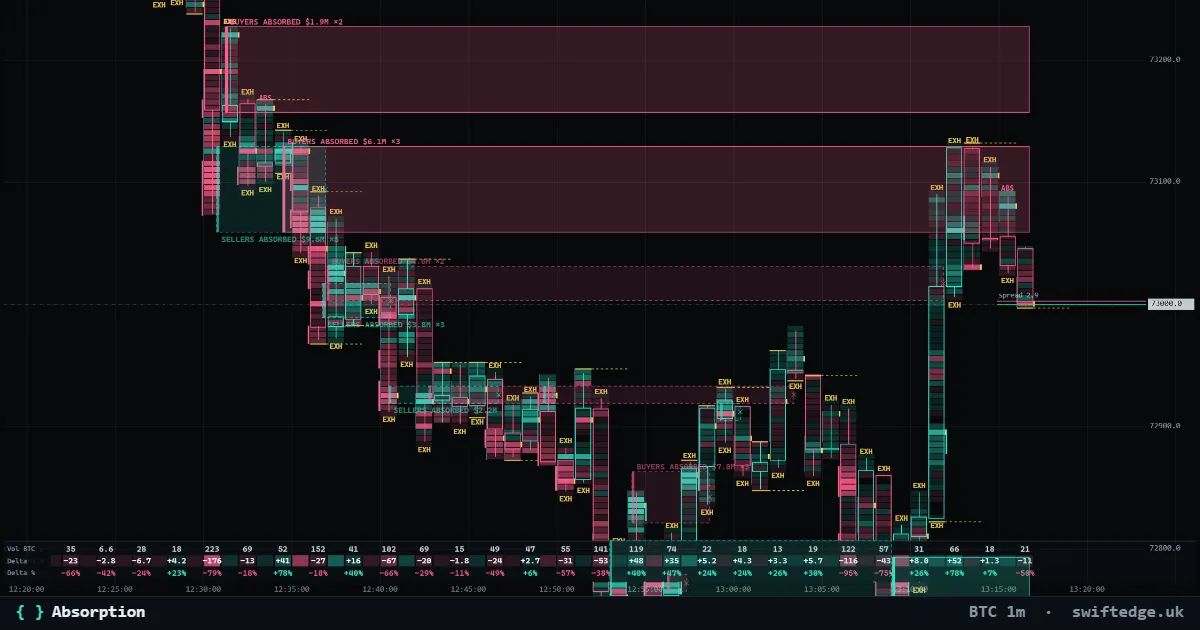
Zones where heavy aggressive selling (or buying) hit a price level and price did not get through; the zone runs until price trades past it.
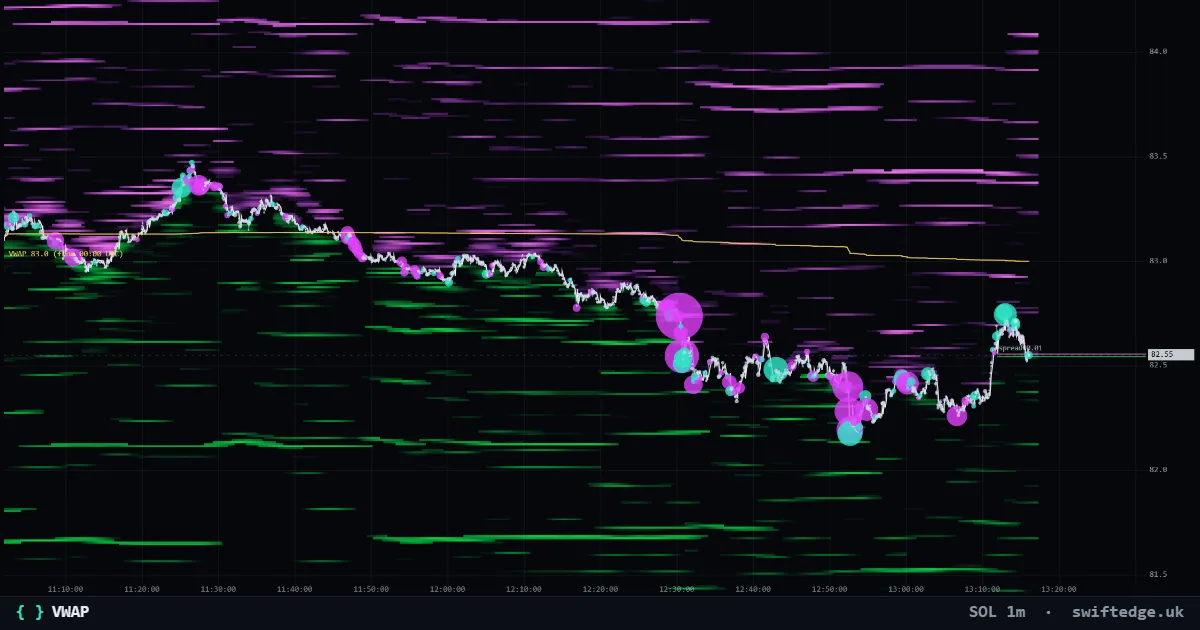
The volume-weighted average price since 7:00 PM ET (00:00 UTC): the average price paid per coin today.