Community scripts › Built into Depth › Session Orbs
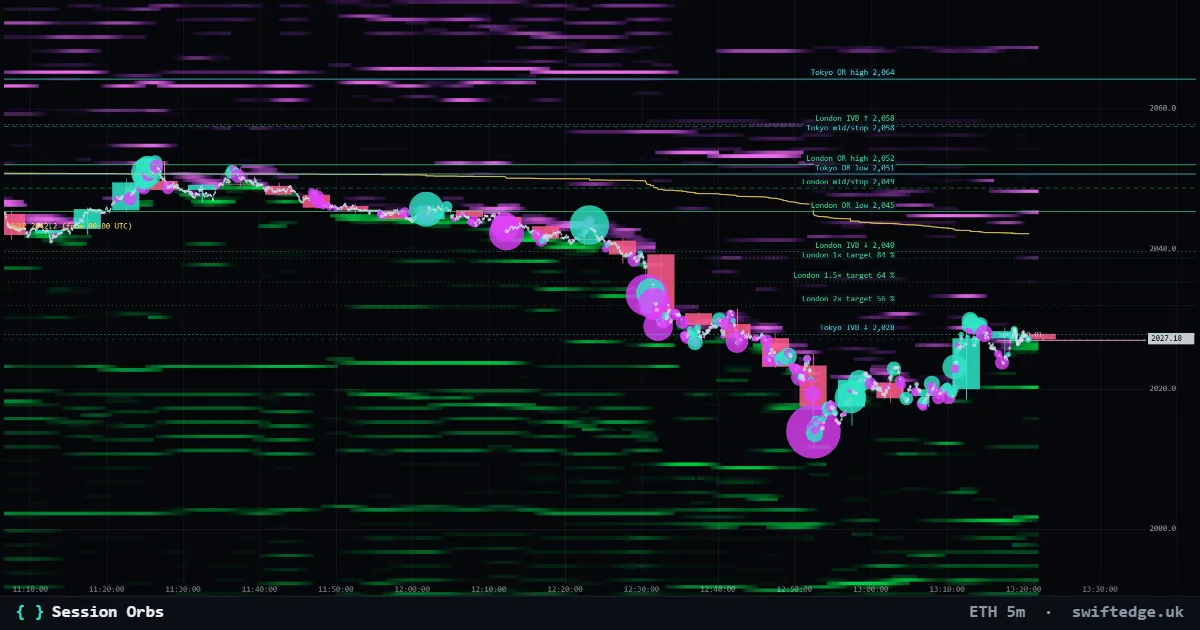
What it shows
The opening range of the Tokyo, London and New York sessions, with targets and how often they were reached historically.
How to read it
Each session's first minutes set a range. The orbs show it, its relative size and extensions above and below with historical hit rates.
How it's calculated
Each of the Tokyo, London and New York sessions starts with an opening range: the high and low of its first minutes. Session Orbs draws that range, compares its size with earlier sessions and adds extensions above and below, each with how often price reached it in the past.
What it can't tell you
Hit rates describe past sessions. They are frequencies, not probabilities for the session in front of you.
FAQ
What is an opening range?
The high and low of the first minutes of a session.
What do the percentages next to the targets mean?
How often price reached that extension during earlier sessions on the same market.
Which sessions are included?
Tokyo, London and New York, each from its own opening time.
More in Order flow
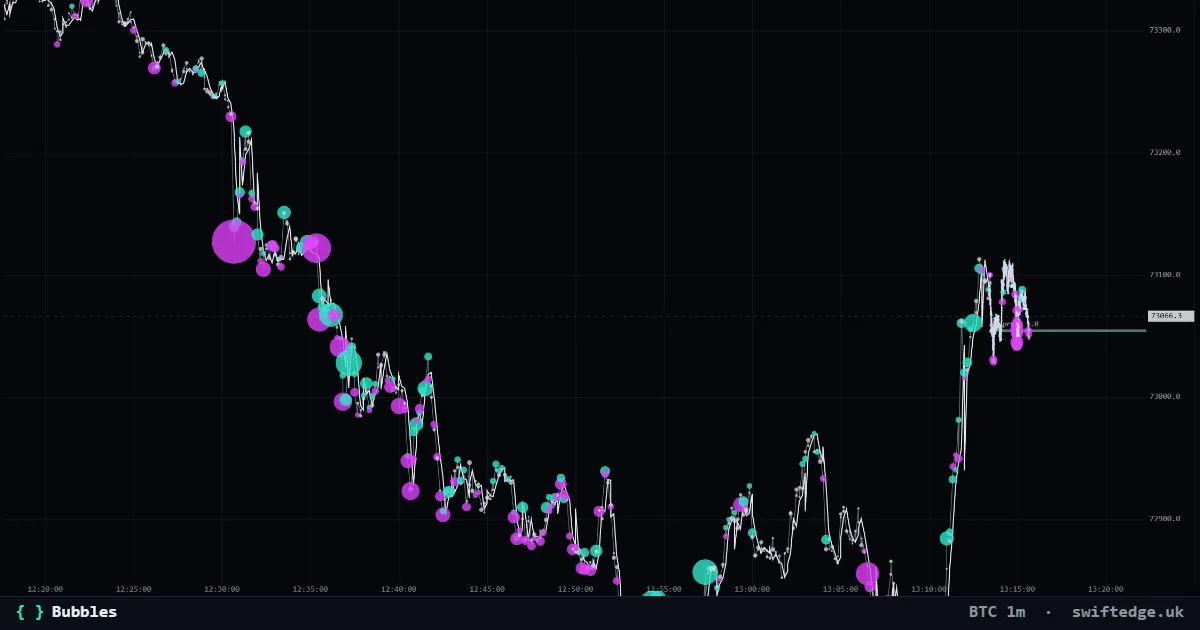
Every trade as a bubble: teal for aggressive buys, violet for aggressive sells; the size is the volume.
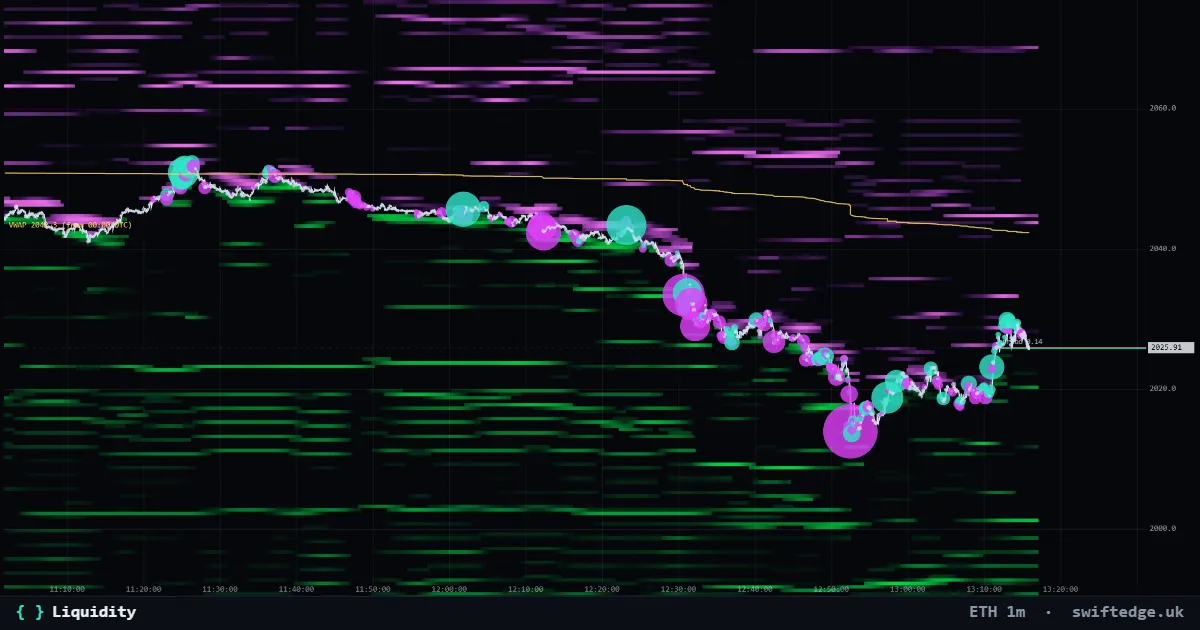
Resting limit orders in the order book by price and time: green bids below price, violet asks above. Brighter means more size.
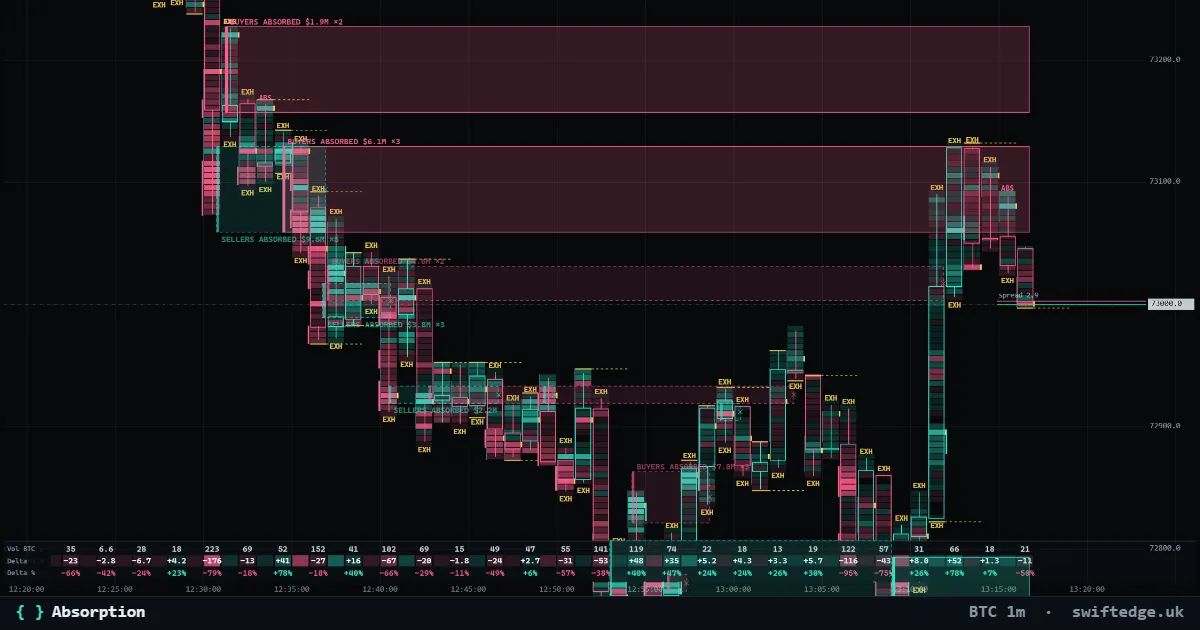
Zones where heavy aggressive selling (or buying) hit a price level and price did not get through; the zone runs until price trades past it.