Community scripts › Built into Depth › VWAP + EMA Retracement
What it shows
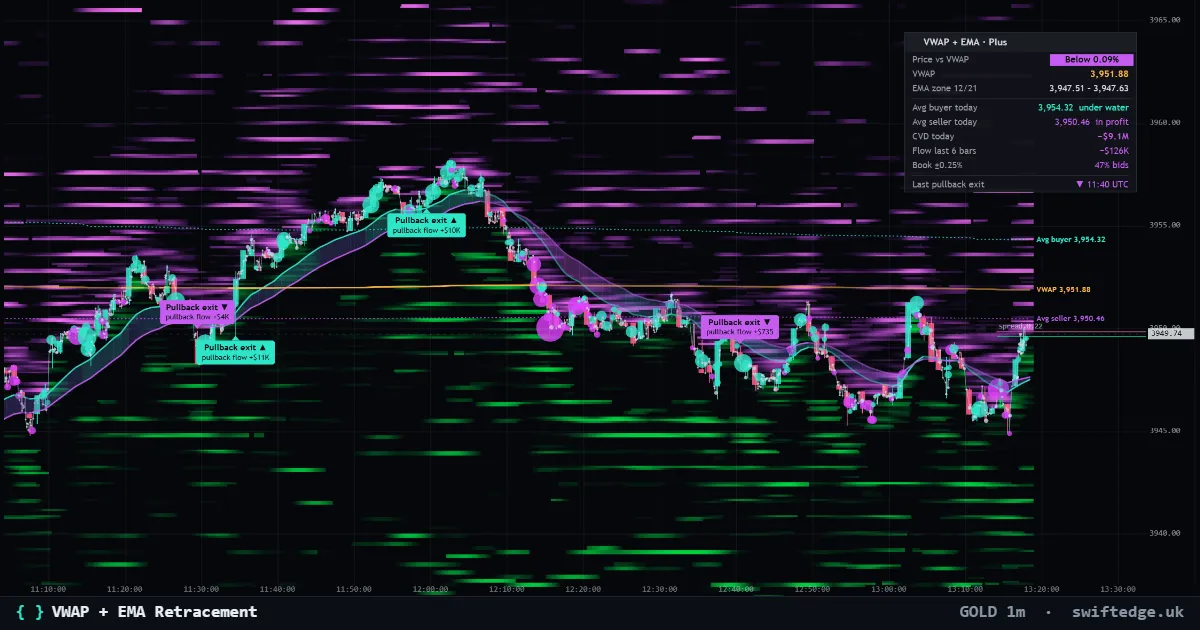
VWAP and the EMA 12/21 zone with pullback exits, the zone colored by real flow and where today's average buyer and seller got in.
How to read it
VWAP is the average price paid today and the EMA 12/21 zone shows the short trend. The zone is colored by the real buy and sell flow, a pullback exit is marked when price leaves the zone again after touching it, and the two labels show where today's average buyer and seller got in.
What it can't tell you
The EMA zone lags price, and VWAP early in the UTC day rests on few trades.
Settings in Depth
| Lines | |
|---|---|
| VWAP (resets 7:00 PM ET (00:00 UTC)) | on |
| EMA 12/21 zone | on |
| Pullback exit marks | on |
| Real data | |
| Color the zone by real flow | on |
| Today's average buyer and seller (real trades) | on |
FAQ
What is the EMA zone?
The area between the 12- and 21-period EMAs of the close.
What does 'average buyer' mean?
The volume-weighted average price of today's aggressive buying; the same for selling.
Can I switch the VWAP off?
Yes, the VWAP and the EMA zone are separate settings.
More in Swiftedge Plus
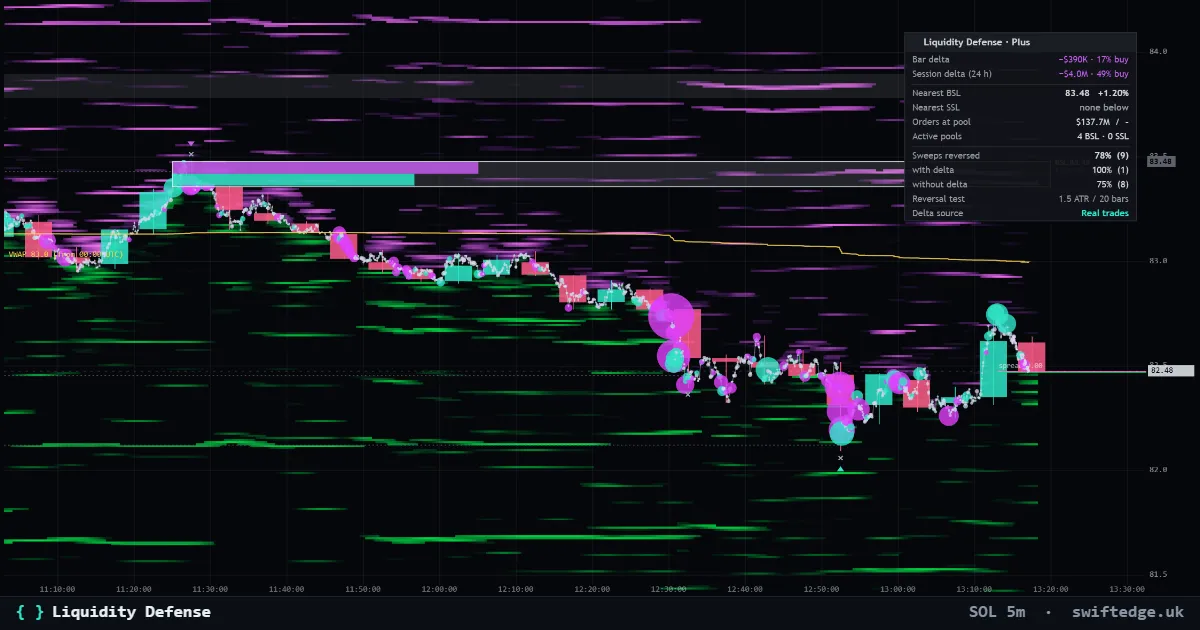
Buy-side and sell-side pools above highs and below lows with formation, defense profile and sweeps, from real trades, with the orders and liquidations at the nearest pools.
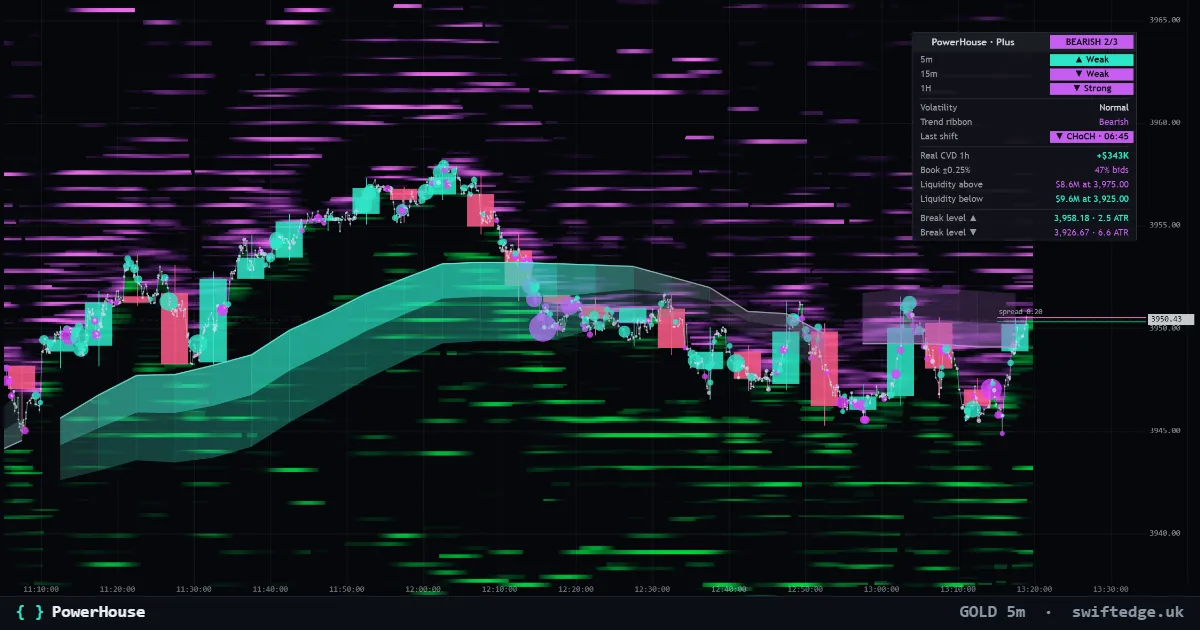
The adaptive trend ribbon, structure shifts (CHoCH and BOS) and a Trend Matrix, with the real walls and liquidation clusters above and below price.
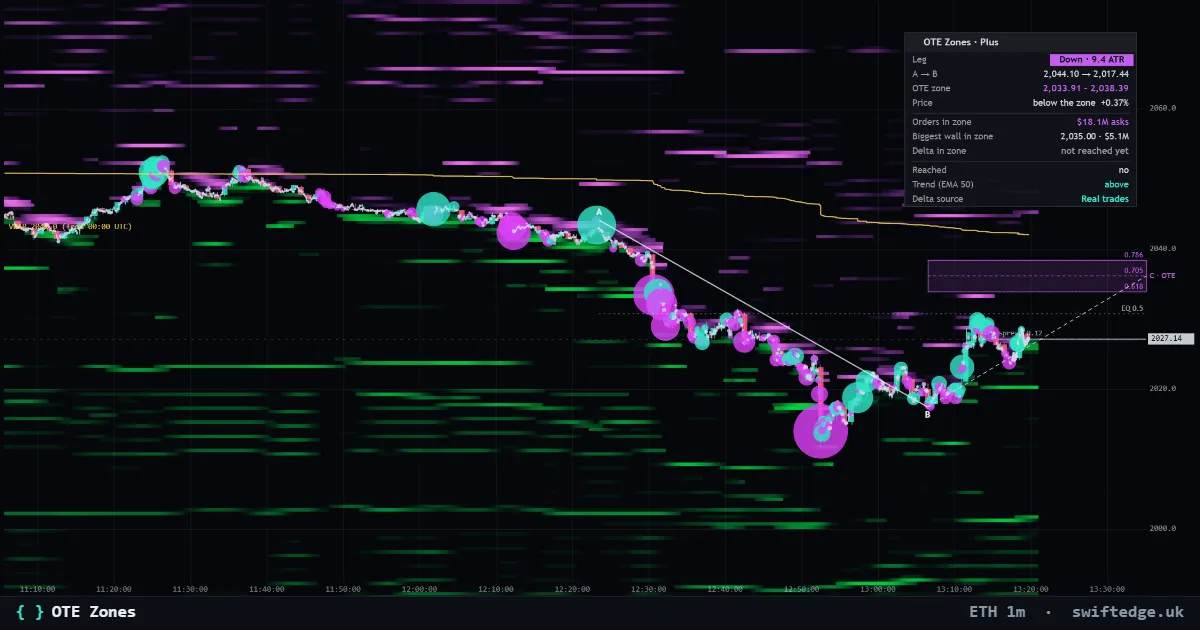
The latest impulse leg A to B and its optimal trade entry zone (0.618 to 0.786), with the real orders and liquidations inside the zone and who traded when price was in it.