Community scripts › Biggest Walls in the Book
Biggest Walls in the Book
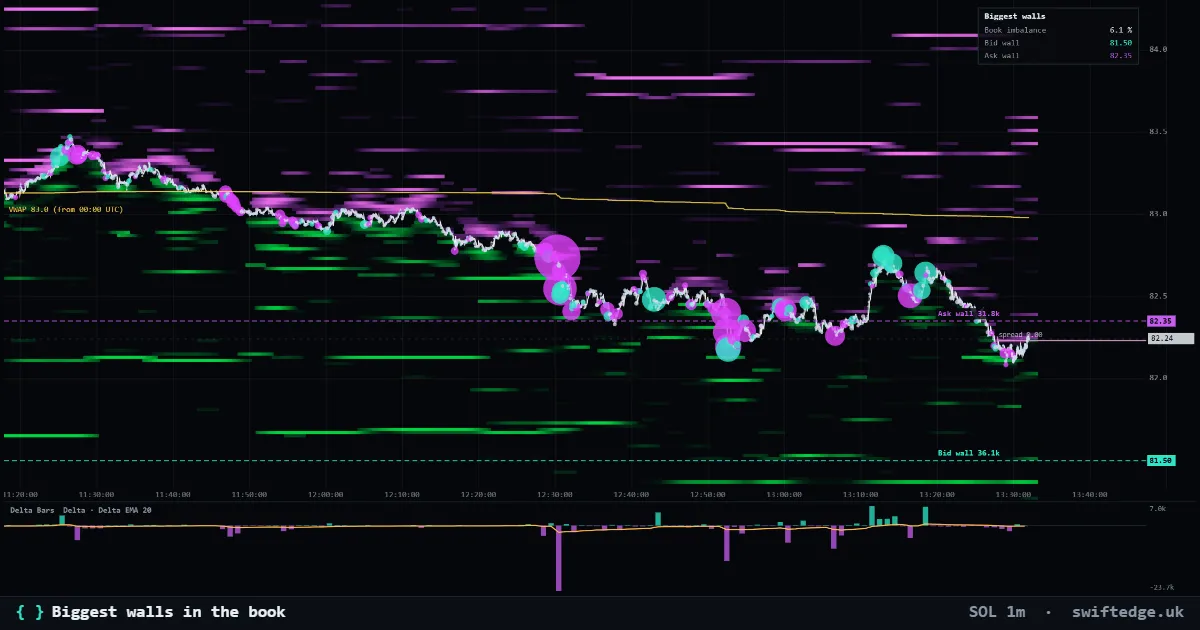
What it does
Draws the largest resting bid and ask in the live order book near the current price, with their size, and a small table with the book imbalance.
How it works
It reads the latest full snapshot of the order book, finds the biggest bid and the biggest ask within a percentage range of price, and measures bid size against ask size inside that range.
How to use it
Set the range in the settings. Watch how price behaves when it reaches a wall: whether the wall is traded through, pulled or keeps refilling. Combine it with the heatmap.
What's original
It works on the real order book, not on estimates from candles, and it shows the size of each wall so you can compare them across markets.
Limitations
Walls can be pulled at any moment and some are never meant to be filled. It uses the latest snapshot, so it shows where liquidity sits now, not where it was.
Source code
Open source under MPL-2.0. Copy it with credit: "Copy to my scripts" adds the credit for you.
script({ name: "Biggest walls" });

const range = input.number(1, "Within % of price", { min: 0.1, max: 5, step: 0.1 });

const bid = book.largestBid({ within: range });
const ask = book.largestAsk({ within: range });

if (bid) plot.level(bid.price, { tone: "bid", label: "Bid wall " + fmt(bid.size) });
if (ask) plot.level(ask.price, { tone: "ask", label: "Ask wall " + fmt(ask.size) });

plot.info([
  ["Book imbalance", fmt(book.imbalance({ within: range }) * 100, 1) + " %"],
  ["Bid wall", bid ? fmt(bid.price, market.decimals) : "–", "bid"],
  ["Ask wall", ask ? fmt(ask.price, market.decimals) : "–", "ask"]
], { title: "Biggest walls" });