Community scripts › Built into Depth › Mentor
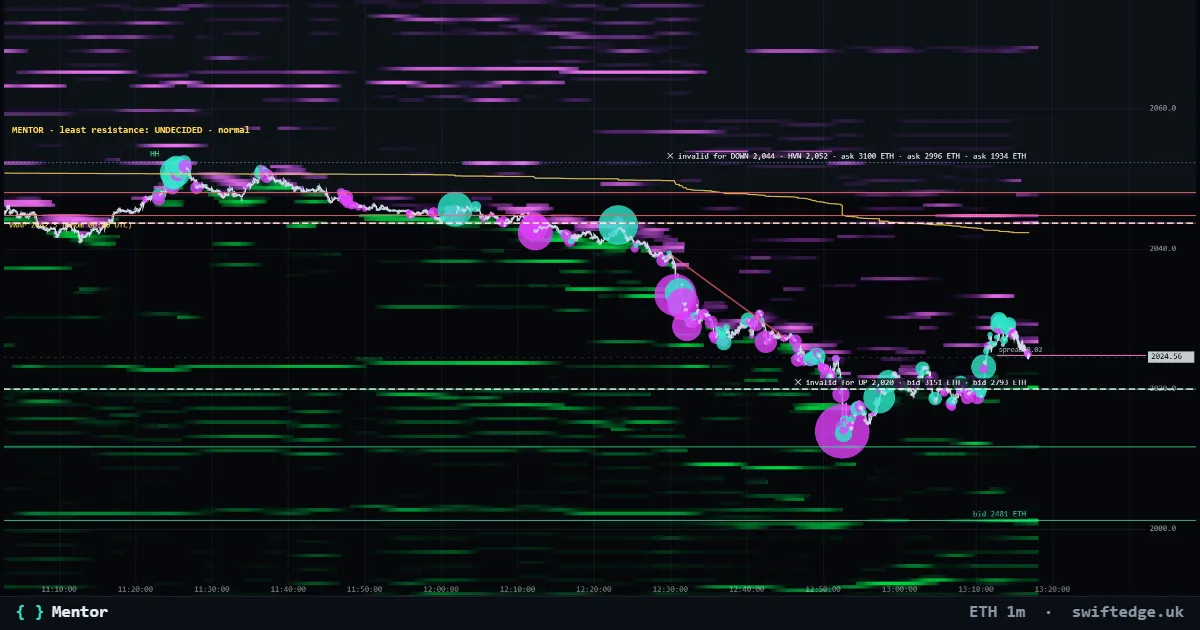
What it shows
A rule-based reading of the chart in seven steps: structure, liquidity, volume profile, flow, timeframes and positioning, with an invalidation level.
How to read it
Mentor writes down what the data shows in a fixed order and where that reading would be wrong. It is descriptive, not a forecast.
How it's calculated
Mentor reads the chart in a fixed order of seven steps: market structure, liquidity, the volume profile, order flow, the higher timeframes and positioning, and it ends with the level where its reading would be wrong. Each step is a rule applied to the same data you see on the chart.
What it can't tell you
Mentor describes what the data shows now. It is not a forecast and does not know about news or events.
FAQ
Is Mentor a signal?
No. It writes down what the data shows in a fixed order, and where that reading would stop being true.
What is the invalidation level?
The price where the reading no longer holds, for example a break of the structure it is based on.
Does Mentor use AI?
No. It is rule based, so the same data always gives the same reading.
More in Order flow
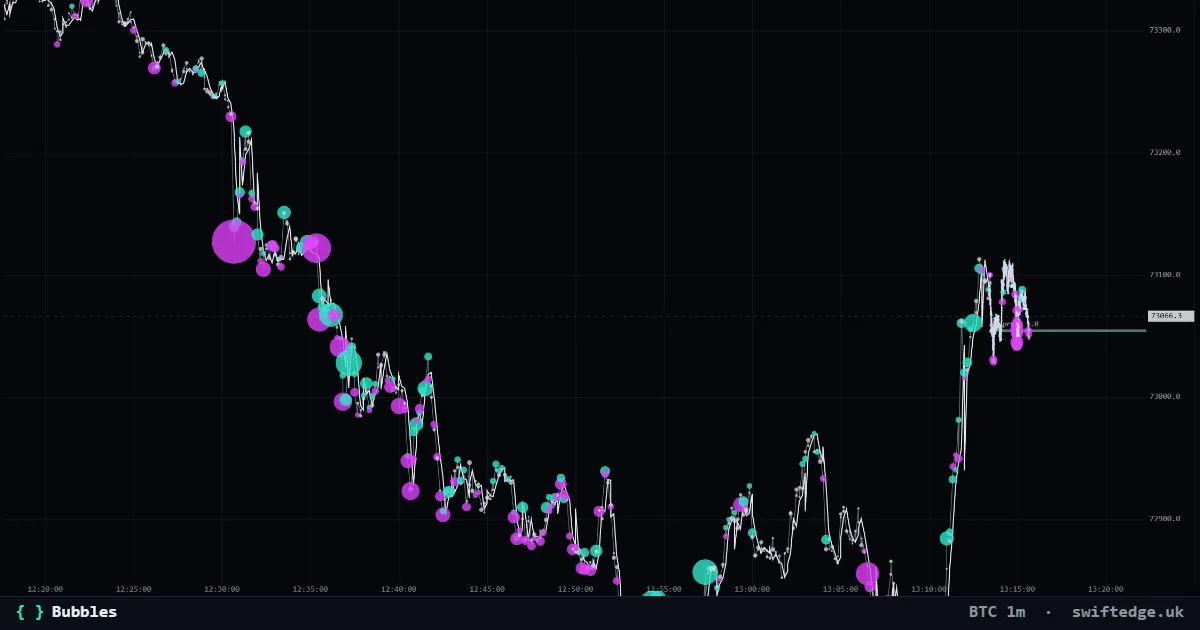
Every trade as a bubble: teal for aggressive buys, violet for aggressive sells; the size is the volume.
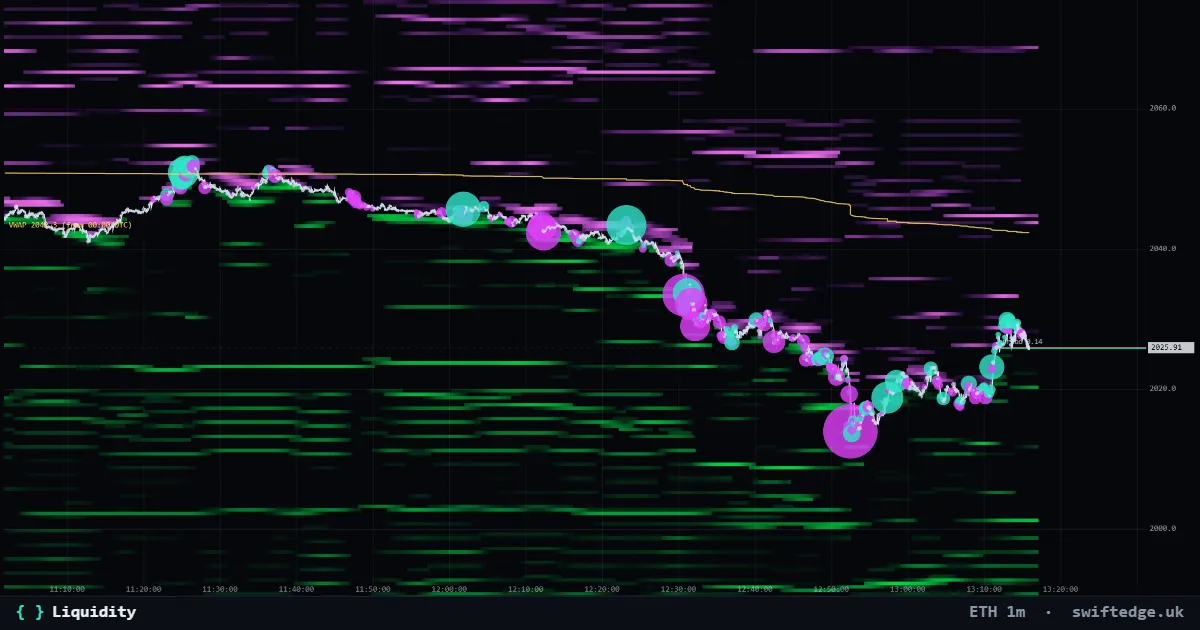
Resting limit orders in the order book by price and time: green bids below price, violet asks above. Brighter means more size.
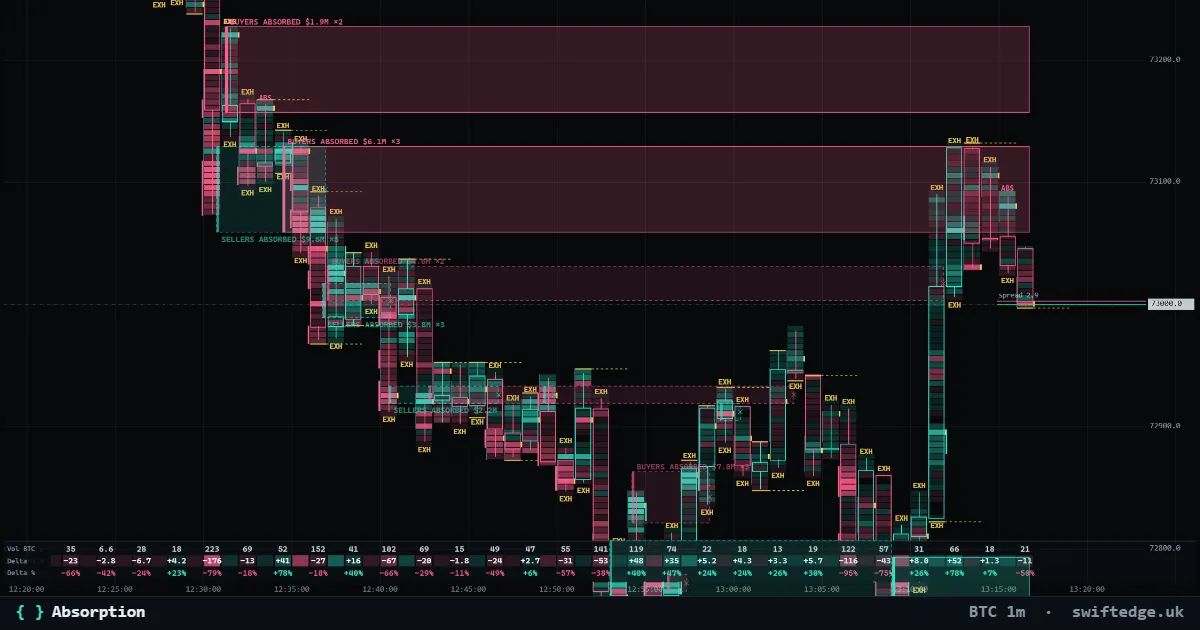
Zones where heavy aggressive selling (or buying) hit a price level and price did not get through; the zone runs until price trades past it.