Live · free · XAUUSDT
Gold order book heatmap
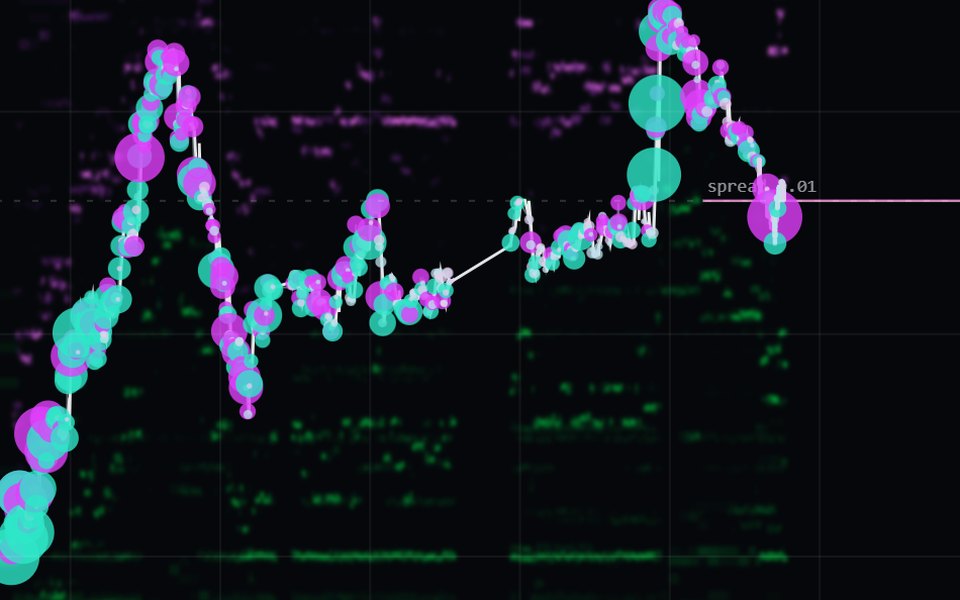
Spot gold (XAU/USD) trades over the counter and has no public order book. The closest public picture is the Binance XAUUSDT perpetual, where one contract is one troy ounce, and Swiftedge Depth draws its book as a heatmap: a new column four times a second, the resting orders out to about 2 % from the price, and every trade as a bubble. Free, in the browser, no account.
Open the live gold heatmapA new column every quarter second, at least 24 hours of history, sizes in ounces (oz).
Open gold in DepthWhat the gold heatmap shows
Time runs from left to right and the gold price in US dollars runs up the side. Every thin horizontal band is one price level of the XAUUSDT book, shaded by how many ounces are resting there: green below the price for bids, violet above it for asks. The brighter the band, the more size is waiting. On top of the book the price can be a line, candlesticks from 1 second to 4 hours, or a gold footprint chart. Trades appear as bubbles, teal when a buyer took the ask and violet when a seller hit the bid; bigger trades make bigger bubbles.
The indicator menu adds Liquidations (forced closes of leveraged XAUUSDT positions on Binance, Bybit and OKX), VWAP, CVD (which side was aggressive), volume profile and TPO, and in the footprint diagonal 300 % imbalances, stacked imbalances, the point of control and delta. Alerts and 26 drawing tools work here too, and prices keep two decimals.
What is different about the gold book
- It is a perpetual, not spot. XAUUSDT tracks the gold price with a funding payment every 4 hours. It is not the LBMA price or the COMEX future, and Swiftedge does not show those prices. The perpetual is simply the deepest order book for gold that anyone can watch for free.
- It keeps trading when gold is closed. Spot gold and COMEX close from Friday 17:00 to Sunday 18:00 New York time and for an hour every weekday. The perpetual trades on, but thinly: from 15 September to 27 October 2026, an hour with spot gold closed at the weekend averaged 8.4 % of the volume of an open hour (n = 999 hourly candles), with a typical hourly range of 0.06 % against 0.35 %. Swiftedge marks every closed hour; gold trading sessions lists them in your time.
- The New York morning dominates. In the same period, 12:00 to 17:00 UTC, the five hours around the COMEX open, carried 37.1 % of weekday volume. Expect walls to be tested, and filled or pulled, mostly then.
- Few, large walls. In an hour of our own data on 27 October 2026, 99.9 % of the $0.50 price levels held less than 487 oz, and the largest held 559 oz. A single wall of a few hundred ounces therefore stands out clearly, and can be placed or pulled with comparatively little money.
How to read it, step by step
- Look for bright bands close to the price. Large resting orders show where gold may slow down. A band that has stood for several minutes says more than one that just appeared.
- See what happens when the price gets there. If trades hit the band and it holds, the liquidity was real. If it vanishes just before the price arrives, it was pulled, not filled.
- Read the bubbles. A cluster of large bubbles at one level shows who is in a hurry. Heavy buying into a violet band while the price stays put means sellers are absorbing it.
- Check the clock. Is spot gold open, is it the London morning or the COMEX open, and is US data due? The same wall means something different at 13:30 UTC than on a Saturday. The gold macro dashboard lists the next US releases.
A full walk-through with our measurements is in how to read gold order flow; the general idea of the chart is in what is an order book heatmap?
Gold liquidations on the heatmap
With the Liquidations indicator, every forced close is a ring at the time and price it happened: orange when a long was closed, cyan when a short was. The last 24 hours are summed up on gold liquidations today. Estimated levels where leveraged positions could be closed next are on the gold liquidation heatmap, and the model behind it is in gold liquidation heatmap explained.
Gold on Swiftedge
- Live gold order flow: price, walls, sessions and the latest reports on one page.
- Gold in Depth, the live heatmap on this page, and the gold Terminal.
- Today's gold report and gold levels today.
- Gold funding rate, gold open interest, gold long/short ratio and gold whale trades.
- Gold trading sessions, the gold macro dashboard and the gold COT report.
Common questions
Is there a free gold order book heatmap?
Yes. Swiftedge Depth shows the live XAUUSDT order book as a heatmap, free in the browser and without an account, at swiftedge.uk/gold/depth.
Is this the order book of spot gold?
No. Spot gold trades over the counter between banks and dealers and has no public order book, and COMEX data is licensed. The heatmap shows the Binance XAUUSDT perpetual, the closest public picture of gold order flow. Its price can differ from spot gold, most of all while spot gold is closed.
Why are the sizes in ounces?
One XAUUSDT contract is one troy ounce (31.1035 grams), so walls, trades and liquidations are shown in ounces (oz) and prices in US dollars per ounce.
Does the gold heatmap work at the weekend?
Yes, the perpetual trades around the clock, but spot gold is closed from Friday 17:00 to Sunday 18:00 New York time, and the book is thin then. Swiftedge marks the closed hours on every gold page.
Is this the same as a gold liquidation heatmap?
No. An order book heatmap shows orders that are actually resting in the book. A liquidation heatmap estimates where leveraged positions could be closed by force; Swiftedge has that as a separate page, the gold liquidation heatmap.
Is this financial advice?
No. Swiftedge shows market data and descriptive analysis. Nothing on the site is a recommendation to buy or sell.