Community scripts › Built into Depth › GEX & Positioning
GEX & Positioning
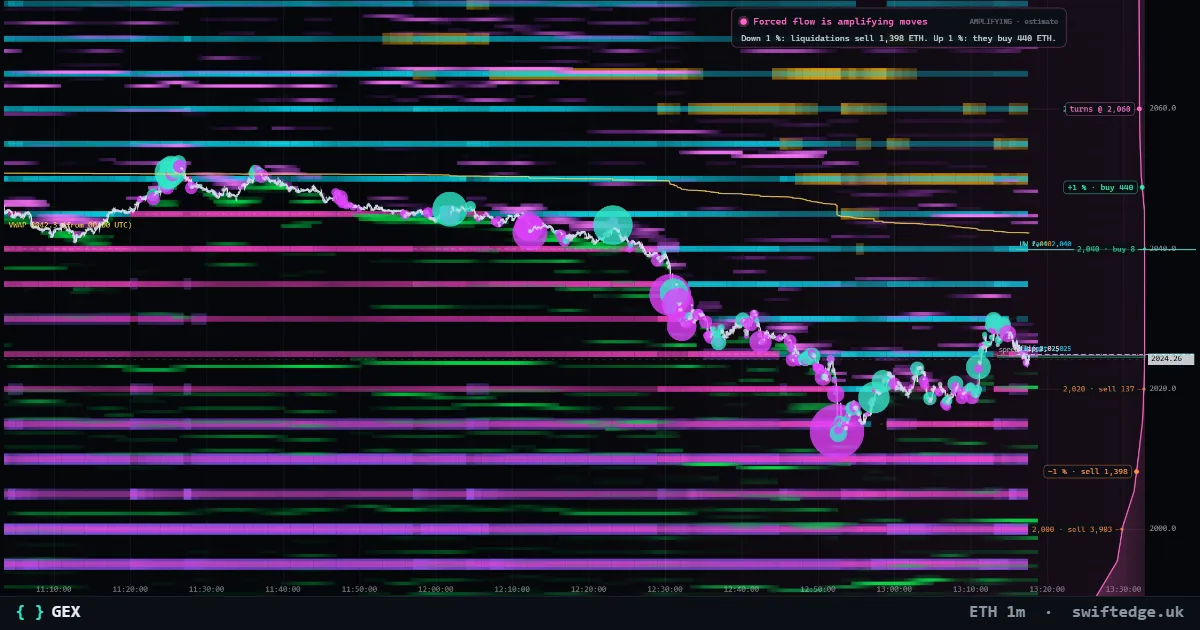
Dealer gamma levels from the options market, and positioning for gold. Shows where hedging flows can pin or push price.
What it shows
GEX for Bitcoin, Ethereum and Solana, the options gamma by price with the gamma flip, call wall and put wall, computed in your browser from public options data. Gold: where leveraged positions would be liquidated (Swiftedge Positioning).
How to read it
For Bitcoin, Ethereum and Solana the layer is GEX: your browser fetches public options data and estimates the gamma at each price, with the gamma flip, call wall and put wall; the dealer positioning behind the sign is an assumption. Gold has no public options data, so the same layer shows Swiftedge Positioning there. Swiftedge Positioning adds up public open positions and the resting orders in the order book at each price level and shows where leveraged positions would be force-closed. The upper wall and lower wall are the largest walls of liquidations and resting orders above and below the price, the flip is the balance point between longs and shorts, fast walls are the biggest resting order walls in the order book within 3 % of price, updated every minute, and max liquidation is the price where the most positions would be liquidated. It also shows the long/short ratio from real positions. It is an estimate from part of the market's positions; wallet addresses are never shown or stored.
How it's calculated
For Bitcoin, Ethereum and Solana the layer estimates options gamma at each price from public options data, with the gamma flip, call wall and put wall. Gold has no public options market, so there the layer shows Swiftedge Positioning: where leveraged positions would be liquidated, from public open positions and resting orders. The table shows the Positioning levels (upper wall, flip and lower wall) for the markets where position data is available right now.
What it can't tell you
Both are estimates. GEX assumes how dealers are positioned, and Positioning covers only part of the market's positions.
GEX & Positioning on 5 markets right now
| Market | Price | Positioning levels | Reading | |
|---|---|---|---|---|
| Bitcoin | 71,915 | Upper 73,000 · Flip 71,750 · Lower 71,750 | Price above the flip, 1.51 % under the upper wall, 0.23 % over the lower wall | Open chart › |
| Ethereum | 1,995 | Upper 1,995 · Flip 1,985 · Lower 1,980 | Price above the flip, 0.02 % under the upper wall, 0.74 % over the lower wall | Open chart › |
| Solana | 80.97 | Upper 80.75 · Flip 80.50 · Lower 80.25 | Price above the flip, 0.90 % over the lower wall | Open chart › |
| XRP | 1.0270 | Upper 1.0250 · Flip 1.0200 · Lower 1.0175 | Price above the flip, 0.93 % over the lower wall | Open chart › |
| US 500 | 7,562.38 | Upper 7,575.00 · Flip 7,550.00 · Lower 6,925.00 | Price above the flip, 0.17 % under the upper wall, 9.20 % over the lower wall | Open chart › |
FAQ
Why is GEX only shown for Bitcoin, Ethereum and Solana?
They are the markets in Depth with public options data. Other markets have no options chain to calculate it from.
What is the flip?
The price where the estimated positioning changes sign, for example from long to short gamma.
Are wallet addresses shown?
No, never. Positioning only adds up positions by price.
More in Liquidations & positioning
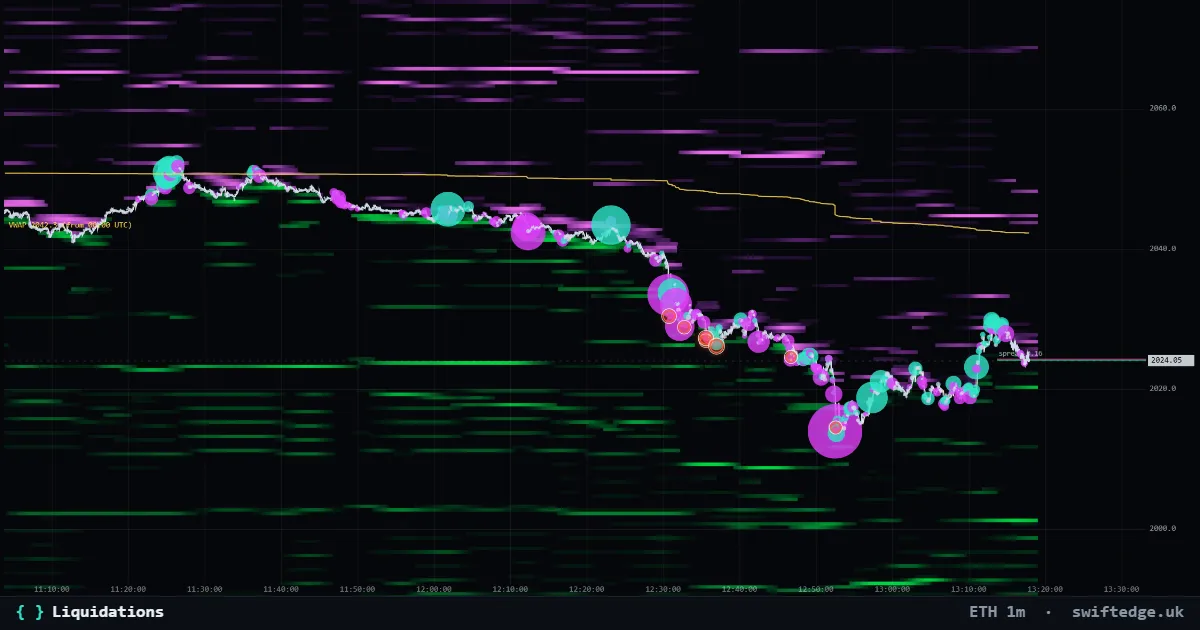
Real forced closes in perpetual futures: orange when a long was liquidated, cyan when a short was; size by dollar value.
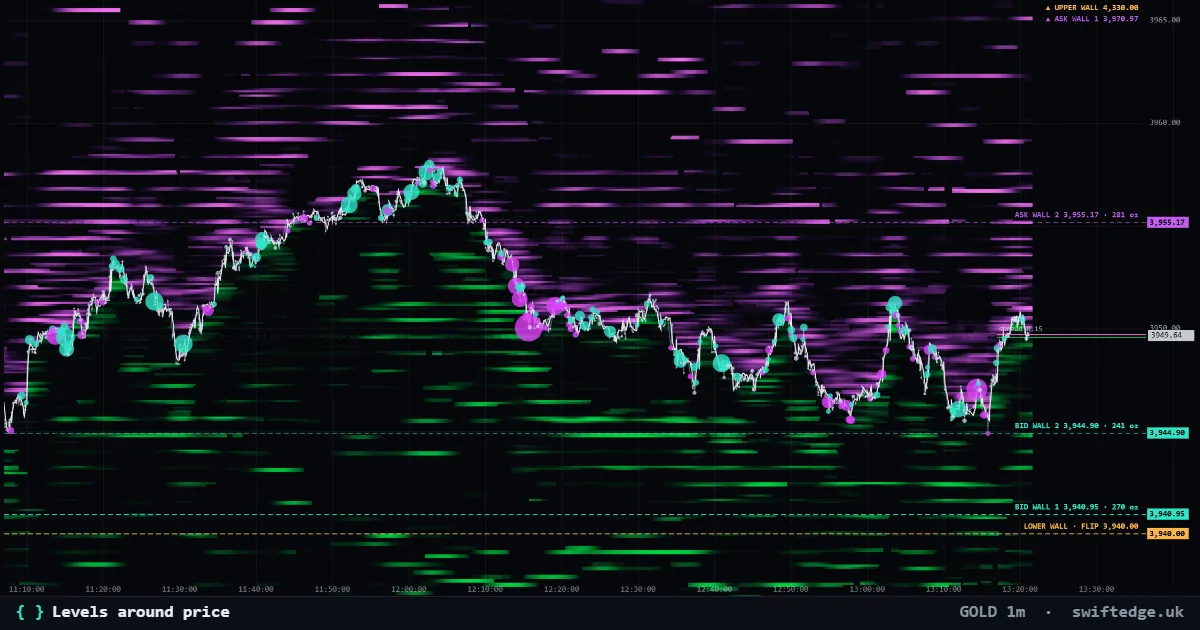
The biggest bid and ask walls near the price and the Positioning levels (upper wall, lower wall, flip, max liquidation) as lines with name and price. Pick which levels to show in the settings.