Guide
What is CVD? Cumulative volume delta for Bitcoin
Cumulative volume delta, or CVD, is a running total of aggressive buying minus aggressive selling. It answers a simple question: since the start of the day, have traders who cross the spread been mostly buying or mostly selling? This guide explains how it is built, how to read it next to the order book, and what two and a half years of Bitcoin data say about what it can and cannot tell you.
From one trade to CVD
Every trade has two sides: a resting limit order (the maker) and an order that crossed the spread to hit it (the taker, or aggressor). If the taker was buying, the trade adds its size to delta; if the taker was selling, it subtracts. Add up the deltas from a fixed starting point and you get CVD.
delta = taker buy volume − taker sell volume (per bar)
CVD = the running sum of delta since the reset (00:00 UTC in Swiftedge)
For scale: in our data a typical hour of Bitcoin perpetual futures had a delta of about 350 BTC in one direction or the other (median, 2024-2026).
CVD in Swiftedge Depth
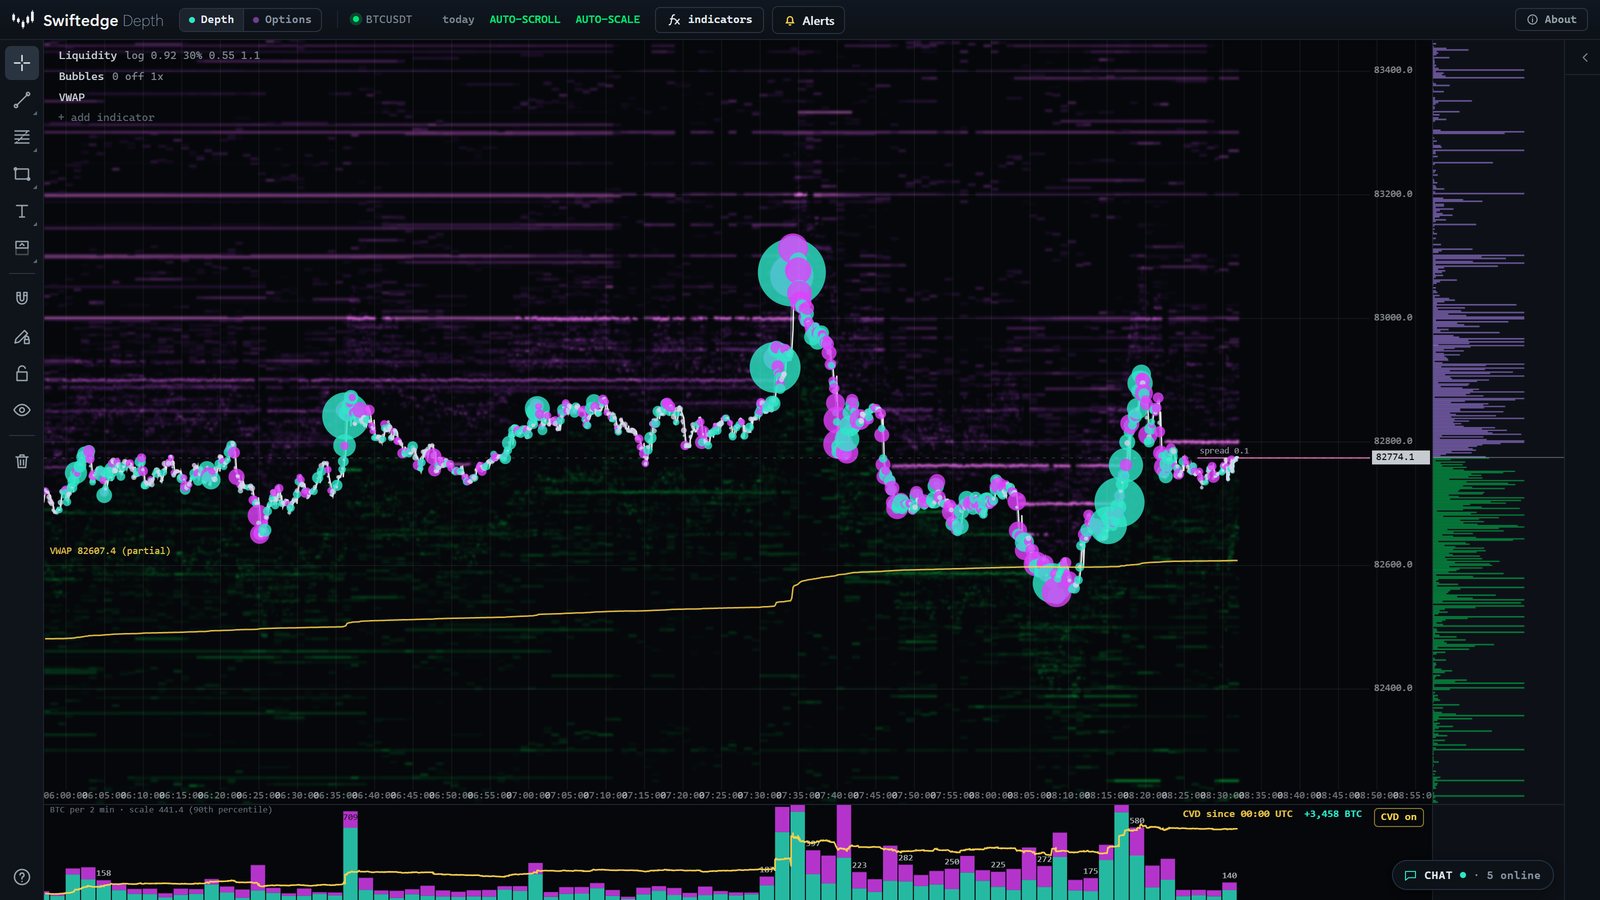
Swiftedge Depth computes CVD from every trade on Binance's BTCUSDT perpetual, using the exchange's own flag for which side was the taker. Older hours are stored with trades combined per side, which gives exactly the same sum. The line resets at 00:00 UTC and is drawn over the volume pane, on the same time axis as the heatmap, so you can see how the balance of aggressive flow changed while price met each liquidity wall.
Why CVD and price move together
An aggressive buy order lifts offers until it is filled, and an aggressive sell order hits bids. So in the short run, buying pressure and price tend to rise together. Our data shows how strong that link is:
- Same hour: the correlation between an hour's delta and that hour's price change was 0.75, and the two pointed the same way in 77 % of hours (24,528 hours, January 2024 to October 2026).
- Stable: 0.78 in the first half of the period and 0.71 in the second.
What CVD did not do: predict the next hour
The correlation between an hour's delta and the next hour's price change was 0.002, which is zero for practical purposes, and it stayed near zero in both halves. CVD describes the move that is happening; it did not tell us about the next one.
Divergences, tested
A popular reading is the "divergence": price makes a new high but CVD does not, so buyers are said to be running out and a reversal is near (and the mirror image at lows). We tested it on every hour where the close made a new high or low of the UTC day, and compared the next four hours with and without a divergence.
| Hourly close makes a new high or low of the UTC day | Cases | Up 4 hours later | Median 4-hour move |
|---|---|---|---|
| New high, CVD below its high of the day ("bearish divergence") | 2,080 | 48.8 % | −0.01 % |
| New high, CVD also at or near its high | 2,337 | 46.3 % | −0.05 % |
| New low, CVD above its low of the day ("bullish divergence") | 1,254 | 55.2 % | +0.09 % |
| New low, CVD also at or near its low | 2,848 | 55.7 % | +0.09 % |
New highs with a bearish divergence rose over the next four hours about as often as new highs without one, in fact slightly more often. At new lows, a bullish divergence made no difference. The pattern was the same in both halves of the period. In this data a CVD divergence on its own did not mark turning points.
Where CVD helps: reading absorption
CVD becomes more useful next to the order book. If CVD climbs steeply while price barely moves, aggressive buyers are being filled by someone passive, often a wall of resting sell orders you can see in the heatmap. That is absorption. Whether the wall then holds, is eaten or is pulled is something you see in the book, not in CVD alone. The takers, makers and absorption guide walks through it.
Limits
- One venue. Swiftedge's CVD covers Binance's BTCUSDT perpetual, the largest Bitcoin futures market, but not spot exchanges or other venues, where the balance can differ.
- The reset matters. CVD since 00:00 UTC and CVD since the London open can tell different stories about the same hour.
- Size is not intent. Aggressive selling can be a hedge, a liquidation or a profit-take; CVD counts them all the same.
See CVD on live data.Swiftedge Depth draws CVD over the volume pane, under the live Bitcoin order book heatmap and every trade. Free, no sign-up.
Open Swiftedge DepthCommon questions
Is rising CVD a buy signal?
No. Rising CVD means aggressive buyers have dominated so far. In our data CVD moved with price in the same hour but said nothing about the next hour, and divergences between CVD and price did not mark reversals.
What is the difference between delta and CVD?
Delta is aggressive buying minus aggressive selling in one bar, for example one hour. CVD adds the deltas up from a starting point, so it shows the balance over the whole session.
Why is my CVD different on another platform?
Different venues, spot or futures, a different reset time, or a different rule for which side was aggressive. Swiftedge uses every trade on Binance's BTCUSDT perpetual, the exchange's own taker flag, and resets at 00:00 UTC.
Where do I find CVD in Swiftedge Depth?
It is drawn as a yellow line over the volume pane at the bottom of Depth. The CVD on/off button in the pane's corner turns it on or off.