Community scripts › EMA Cross with Real Delta
EMA Cross with Real Delta
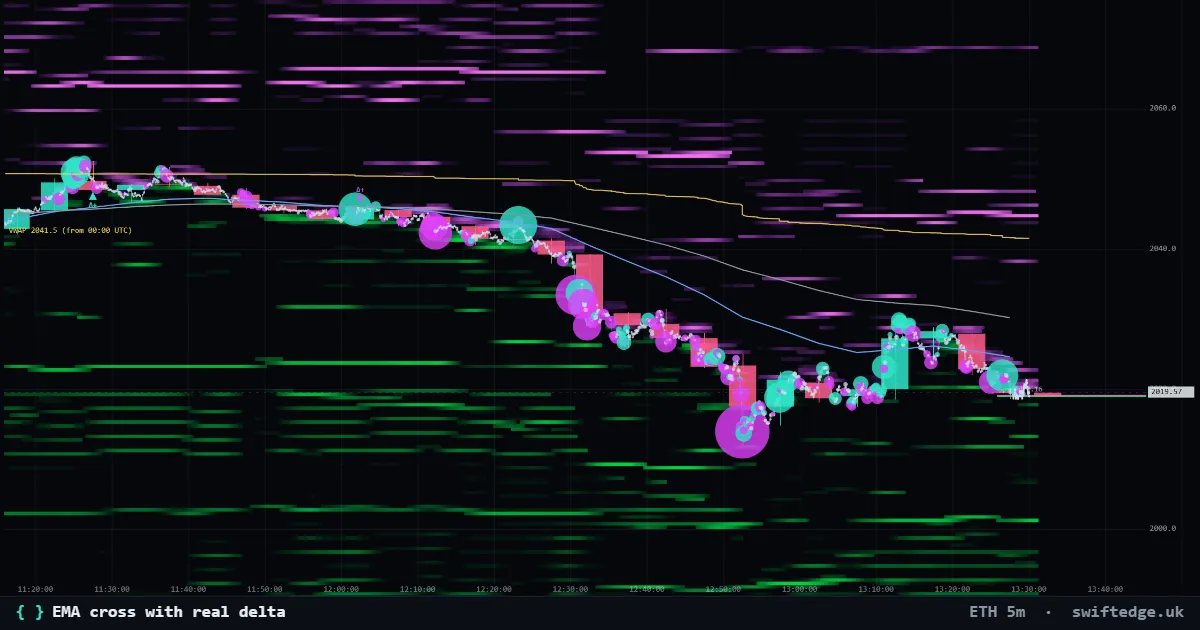
What it does
Two exponential moving averages on price, and a marker at every cross that shows whether real buying or real selling dominated the bar where the cross happened.
How it works
It calculates a fast and a slow EMA on the closing price. At each cross it reads the bar's real delta (taker buy volume minus taker sell volume) and labels the marker with the sign of that delta.
How to use it
Use it as a template for your own crosses. A cross where the delta agrees with the direction was backed by aggressive orders; a cross against the delta was not. Change both lengths in the settings.
What's original
Classic EMA crosses only look at price. This version adds the real order flow of the crossing bar, which a chart without trade data cannot show.
Limitations
Moving-average crosses lag and whipsaw in ranges. Delta of one bar is noisy on low timeframes and on thin markets.
Source code
Open source under MPL-2.0. Copy it with credit: "Copy to my scripts" adds the credit for you.
script({ name: "EMA cross + delta" });

const fast = input.int(9, "Fast EMA", { min: 2, max: 200 });
const slow = input.int(21, "Slow EMA", { min: 3, max: 400 });

const a = ta.ema(close, fast);
const b = ta.ema(close, slow);
plot.line("EMA " + fast, a, { tone: "accent" });
plot.line("EMA " + slow, b, { tone: "muted" });

// Mark each cross and show whether real buying or selling backed that bar
const up = ta.crossover(a, b), down = ta.crossunder(a, b);
for (let i = 0; i < bars.length; i++) {
  if (up[i])   plot.marker(i, low[i],  { shape: "up",   label: delta[i] > 0 ? "Δ+" : "Δ−" });
  if (down[i]) plot.marker(i, high[i], { shape: "down", label: delta[i] < 0 ? "Δ−" : "Δ+" });
}