Community scripts › Built into Depth › NW Envelope
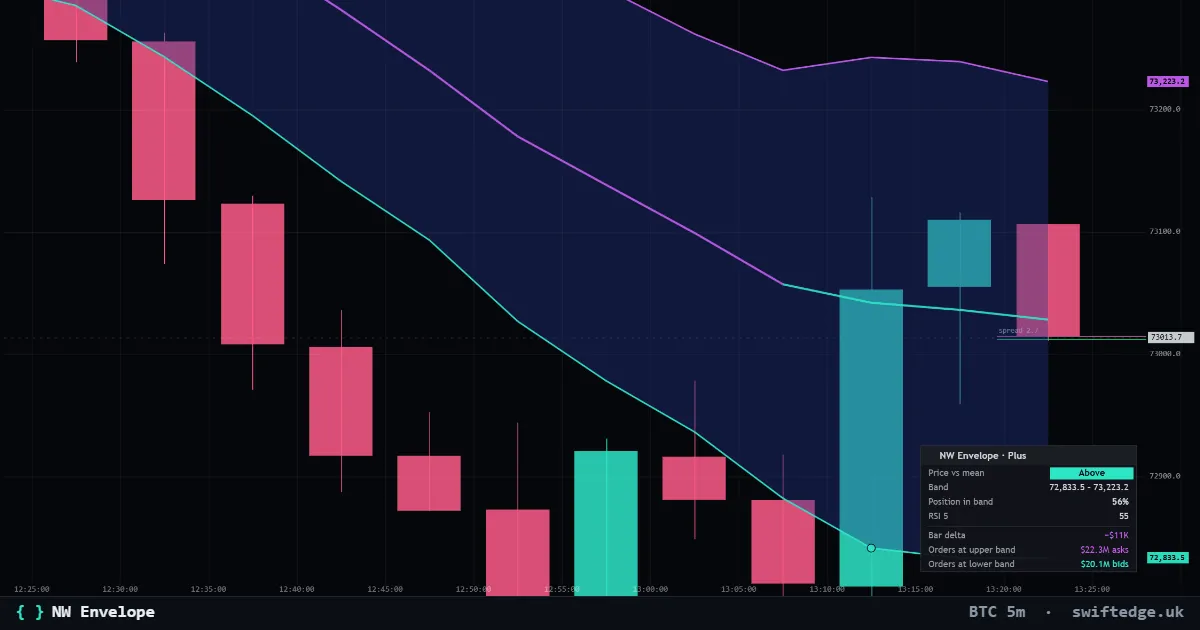
What it shows
A Nadaraya-Watson mean with an ATR envelope and back-inside marks, with the real order book inside the band and the liquidations just outside.
How to read it
The middle line is a smoothed mean of price and the envelope sits a few ATRs around it. A close back inside after a move outside is marked. The book shading shows the real resting orders inside the band, and the dots just outside it show where liquidations would sit.
What it can't tell you
The smoothing uses a window of closes, so the mean near the right edge settles as new candles arrive.
Settings in Depth
| Envelope | |
|---|---|
| Band fill | on |
| Mean line | on |
| Back inside marks (RSI 5 at 30/70) | on |
| Band touches colored by real delta | on |
| Band width | 1.5 ATR |
| Real data | |
| The real order book inside the band | on |
| Liquidations just outside the band | on |
FAQ
What is a Nadaraya-Watson mean?
A kernel-weighted average: closes near each point count more than closes far away, which gives a smooth line.
What is a back-inside mark?
Price closed outside the envelope and then back inside it.
What does the order book add?
The real resting orders inside the band, so you see where size sits within it.
More in Swiftedge Plus
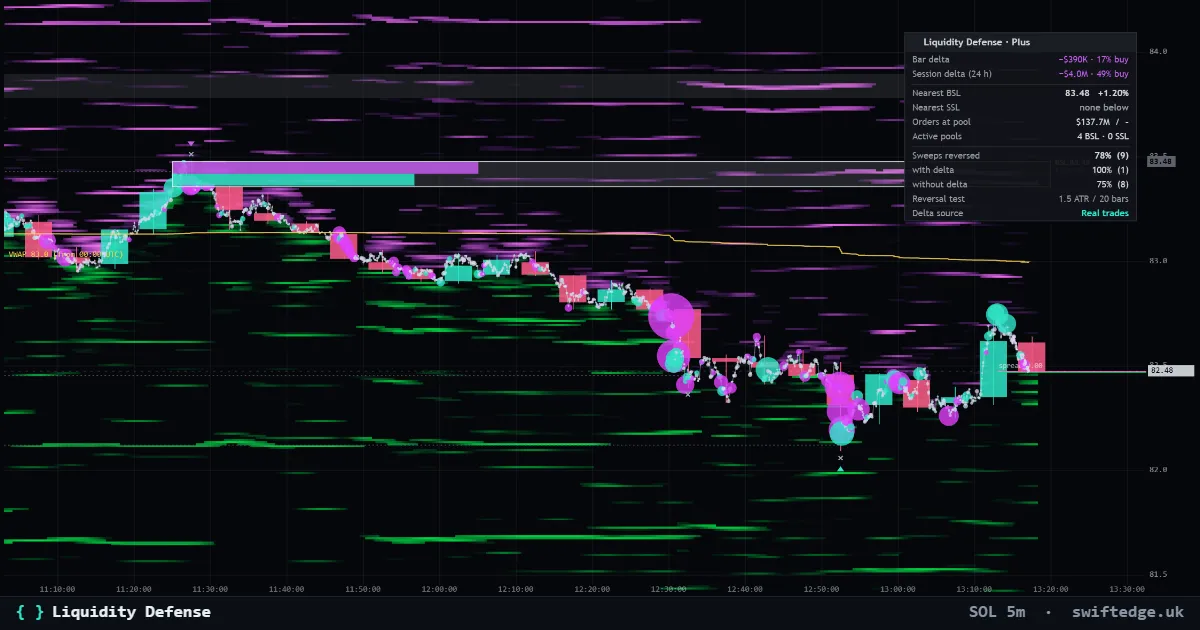
Buy-side and sell-side pools above highs and below lows with formation, defense profile and sweeps, from real trades, with the orders and liquidations at the nearest pools.
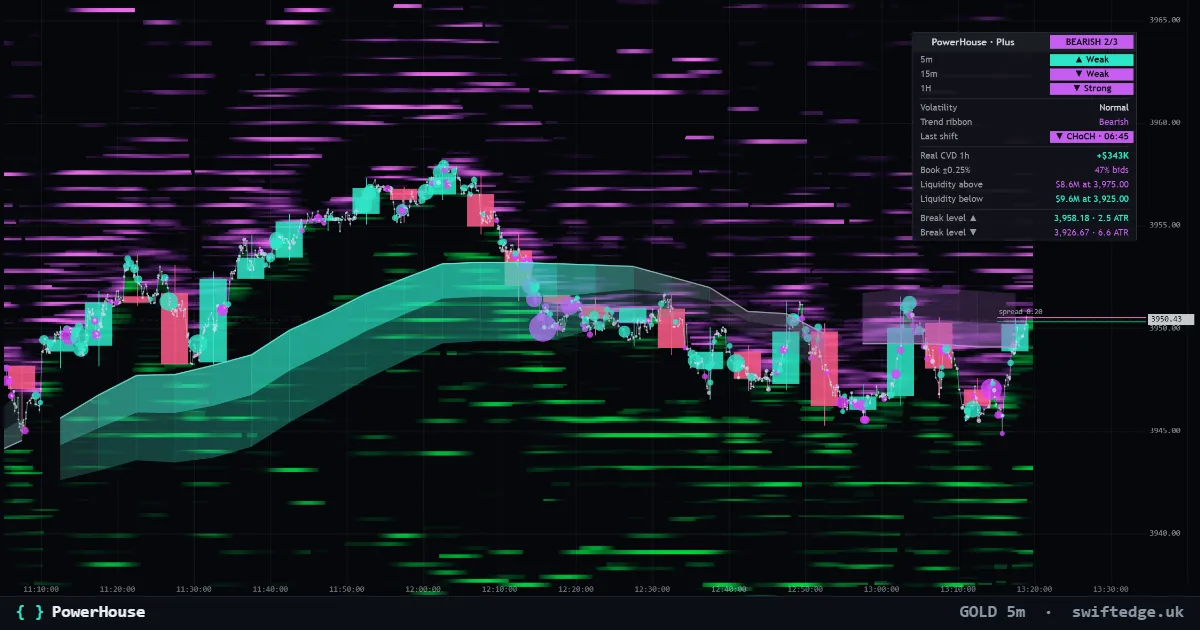
The adaptive trend ribbon, structure shifts (CHoCH and BOS) and a Trend Matrix, with the real walls and liquidation clusters above and below price.
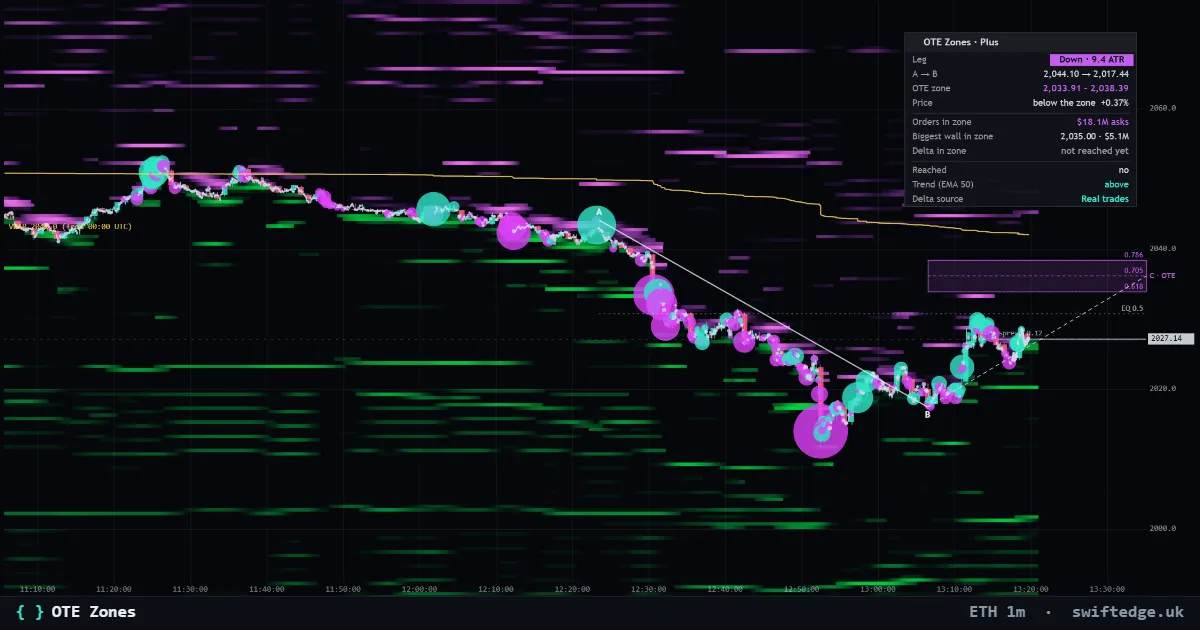
The latest impulse leg A to B and its optimal trade entry zone (0.618 to 0.786), with the real orders and liquidations inside the zone and who traded when price was in it.