Community scripts › Built into Depth › RAM Session Map
What it shows
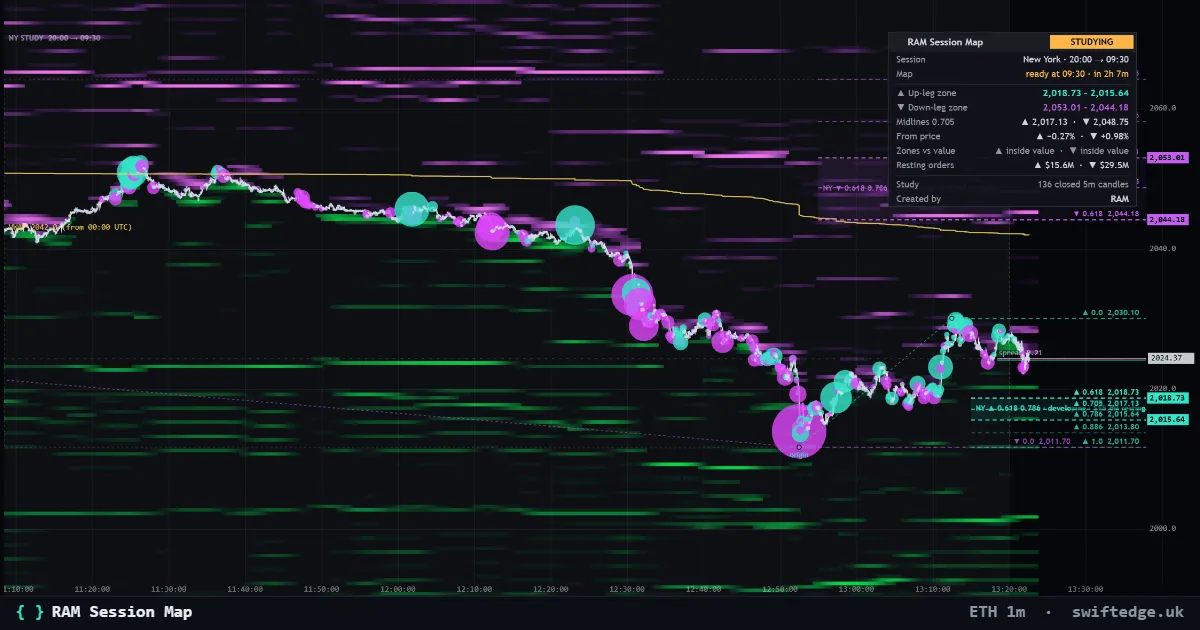
RAM's map of the session ahead: the up-leg and down-leg of the study window before Asia, London or New York opens, with their 0.618 to 0.786 zones frozen at the open. Created by RAM.
How to read it
During the study window (Asia 00:00 to 09:00 Tokyo, London 00:00 to 08:00 London, New York 20:00 or 21:00 the evening before to 09:30 New York) it follows the largest up-leg (an earlier low to a later high) and the largest down-leg on closed 5-minute candles. At the freeze the levels are fixed: the 0.618, 0.705 and 0.786 retracements form the zone, with 0.5 and 0.886 as extra lines. A 5-minute close beyond a leg's origin after the freeze marks that leg invalid. The optional profile splits each leg's volume into real buys and sells, and the dashboard shows the real resting orders inside each zone. It describes the session; it is not a signal.
How it's calculated
During the study window before Asia, London or New York opens, the map follows the largest up-leg (an earlier low to a later high) and the largest down-leg on closed 5-minute candles. At the session open the levels freeze: the 0.618, 0.705 and 0.786 retracements form each leg's zone, with 0.5 and 0.886 as extra lines. A 5-minute close beyond a leg's origin after the freeze marks that leg invalid.
What it can't tell you
The map describes the session that is about to start; it is not a signal. Created by RAM and rebuilt in Depth.
FAQ
When are the levels frozen?
At the open of the session: Asia, London or New York.
What makes a leg invalid?
A 5-minute close beyond the leg's starting point after the freeze.
Who made it?
RAM created the original; Swiftedge rebuilt it in Depth, where it is free.