Community scripts › Built into Depth › TrendCraft ICT
What it shows
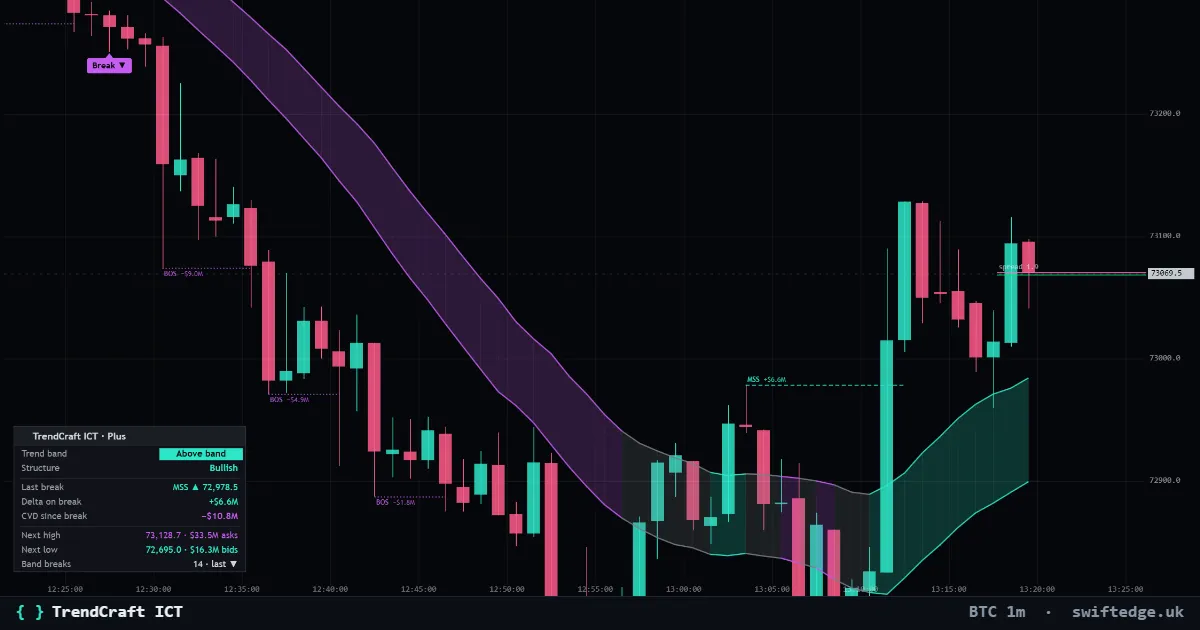
An SMA band of highs and lows with BOS and MSS lines and break marks, with the real delta on every break and the walls behind the next structure levels.
How to read it
The band is a moving average of highs and lows. BOS marks a break of structure in the trend's direction and MSS a market structure shift against it. Each break carries the real delta of the breaking candle, and the walls behind the next structure levels show the orders resting there.
What it can't tell you
Structure is confirmed only after the break. A strong delta at a break says it was aggressive, not that it holds.
Settings in Depth
| Trend band | |
|---|---|
| SMA high/low band | on |
| SMA length | 20 |
| Structure | |
| BOS and MSS lines | on |
| Break marks (close past the last BOS outside the band) | on |
| Pivot length | 2 bars |
| Real data | |
| Real delta on every break | on |
FAQ
What is an MSS?
A market structure shift: a break against the current trend.
Why show delta at each break?
It shows whether aggressive buyers or sellers pushed the break.
Can I change the SMA length?
Yes: 10, 20, 30 or 50.
More in Swiftedge Plus
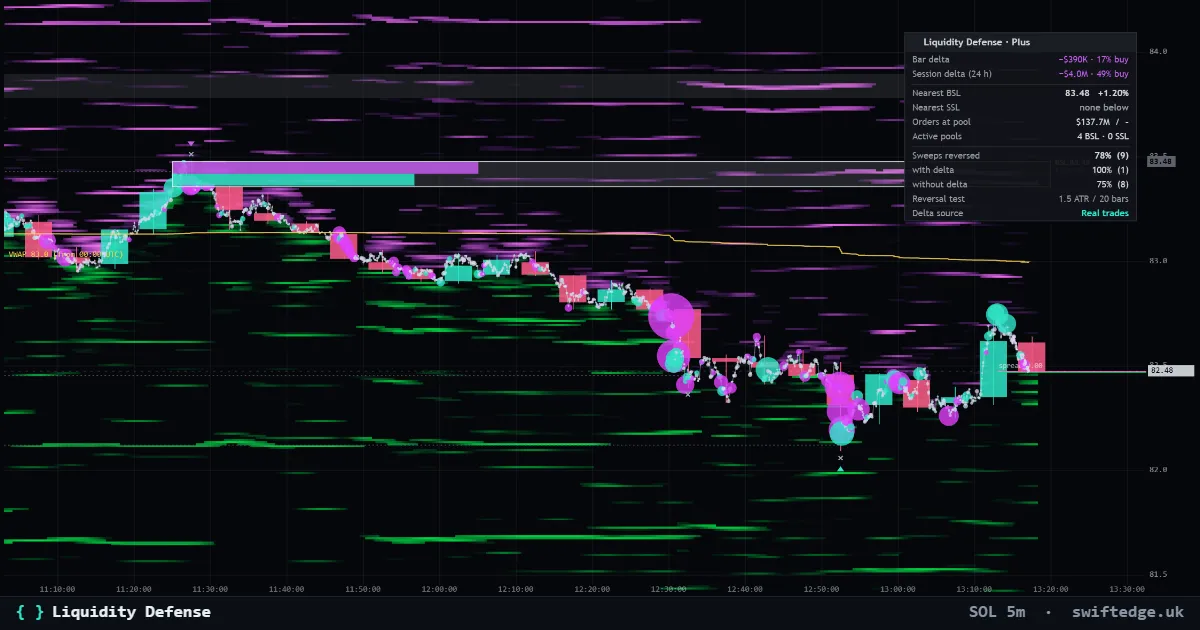
Buy-side and sell-side pools above highs and below lows with formation, defense profile and sweeps, from real trades, with the orders and liquidations at the nearest pools.
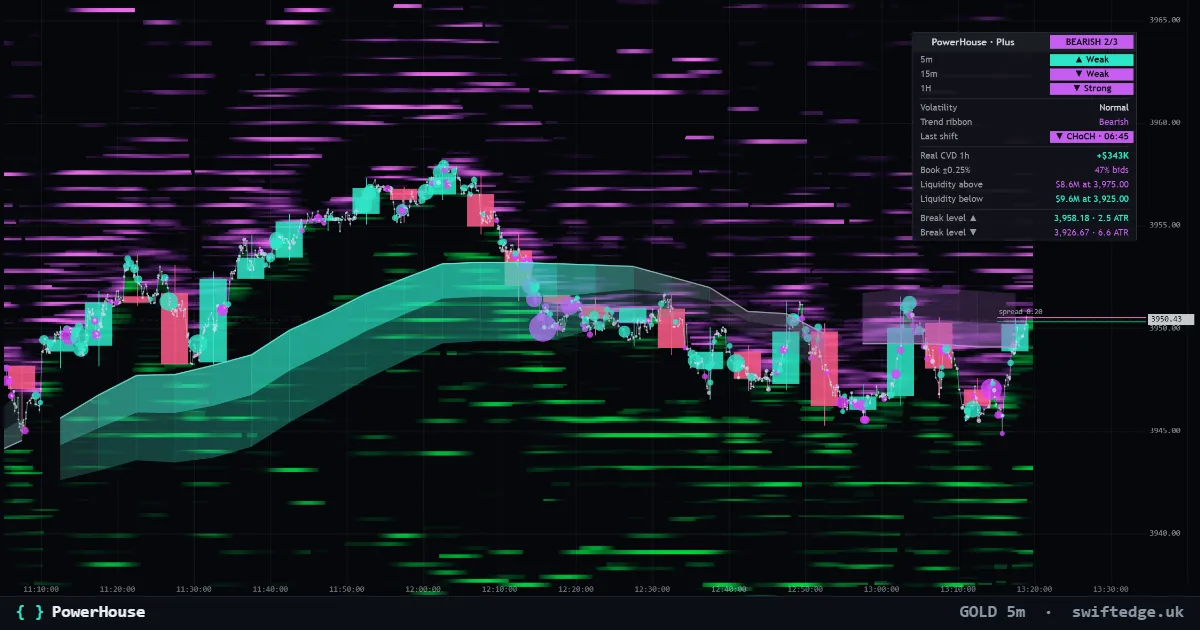
The adaptive trend ribbon, structure shifts (CHoCH and BOS) and a Trend Matrix, with the real walls and liquidation clusters above and below price.
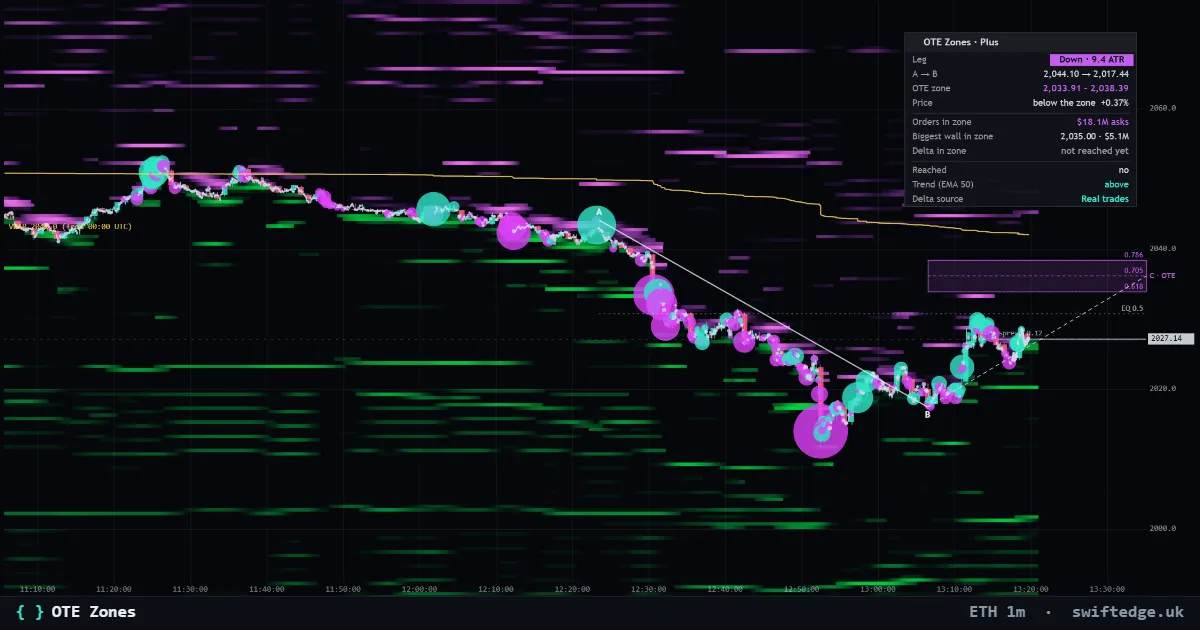
The latest impulse leg A to B and its optimal trade entry zone (0.618 to 0.786), with the real orders and liquidations inside the zone and who traded when price was in it.