Community scripts › Built into Depth › Ichimoku Cloud
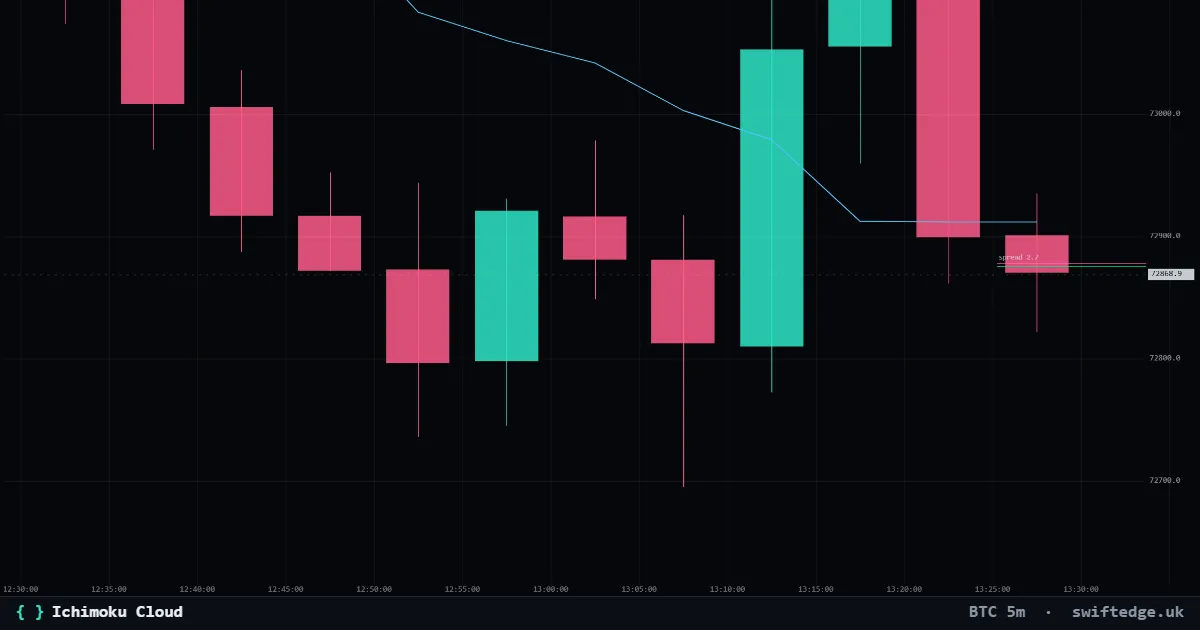
What it shows
Conversion and base lines, the cloud (leading spans A and B, plotted ahead) and the lagging span.
How to read it
Price above the cloud is often read as an uptrend, below as a downtrend; the cloud's thickness shows how far apart the two spans are.
How it's calculated
The conversion line is the midpoint of the highest high and lowest low of the last 9 candles; the base line the same over 26. Leading span A is the average of the two and leading span B the midpoint over 52 candles; both are plotted 26 candles ahead and form the cloud. The lagging span is the close plotted 26 candles back.
What it can't tell you
With the default settings the cloud needs 78 candles of history before it is complete. It describes recent highs and lows only; it uses neither volume nor the order book.
Ichimoku Cloud on 9 markets right now
| Market | Price | Cloud · base line | Reading | |
|---|---|---|---|---|
| Bitcoin | 72,070 | Cloud 73,779–74,110 · Base 73,246 | Price below the cloud; conversion line below base line | Open chart › |
| Gold | 3,899.33 | Cloud 4,046.99–4,072.87 · Base 3,967.75 | Price below the cloud; conversion line below base line | Open chart › |
| Ethereum | 2,012 | Cloud 2,057–2,077 · Base 2,035 | Price below the cloud; conversion line below base line | Open chart › |
| Solana | 81.47 | Cloud 83.20–84.64 · Base 83.09 | Price below the cloud; conversion line below base line | Open chart › |
| XRP | 1.0303 | Cloud 1.0577–1.0731 · Base 1.0493 | Price below the cloud; conversion line below base line | Open chart › |
| US 500 | 7,590.40 | Cloud 7,493.20–7,554.65 · Base 7,596.55 | Price above the cloud; conversion line below base line | Open chart › |
| US 100 | 28,241.2 | Cloud 27,612.8–28,018.6 · Base 28,246.2 | Price above the cloud; conversion line below base line | Open chart › |
| Silver | 50.451 | Cloud 52.455–52.493 · Base 51.529 | Price below the cloud; conversion line below base line | Open chart › |
| WTI crude oil | 85.39 | Cloud 85.36–86.74 · Base 85.94 | Price inside the cloud; conversion line below base line | Open chart › |
Settings in Depth
| Timeframe | the chart's timeframe (or a fixed 1m to 1D) |
| Conversion line | 9 |
| Base line | 26 |
| Leading span B | 52 |
FAQ
What does 'price above the cloud' mean?
The price is above both leading spans that apply to the current candle, which were calculated 26 candles ago and shifted forward.
Why is part of the cloud drawn in the future?
The leading spans are shifted 26 candles ahead by definition, so the right edge of the cloud is known before price gets there.
Can I change 9, 26 and 52?
Yes, all three lengths are settings, and the lagging span can be switched off.
More in Classic indicators
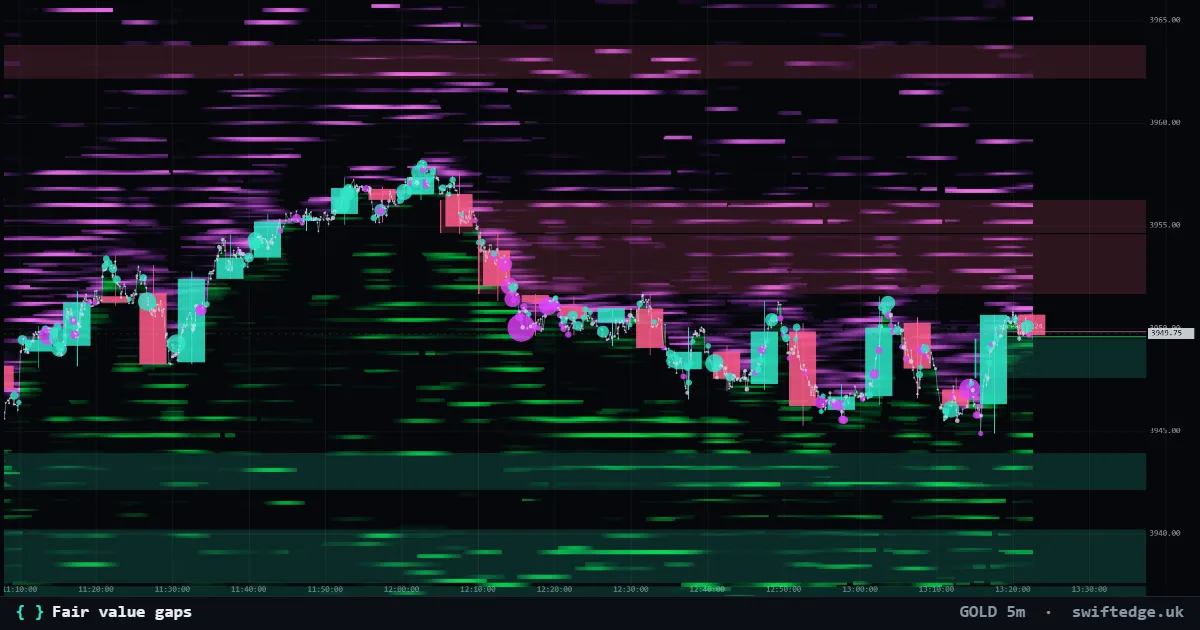
Three-candle gaps where price moved too fast to trade both ways; shown until price fills them.
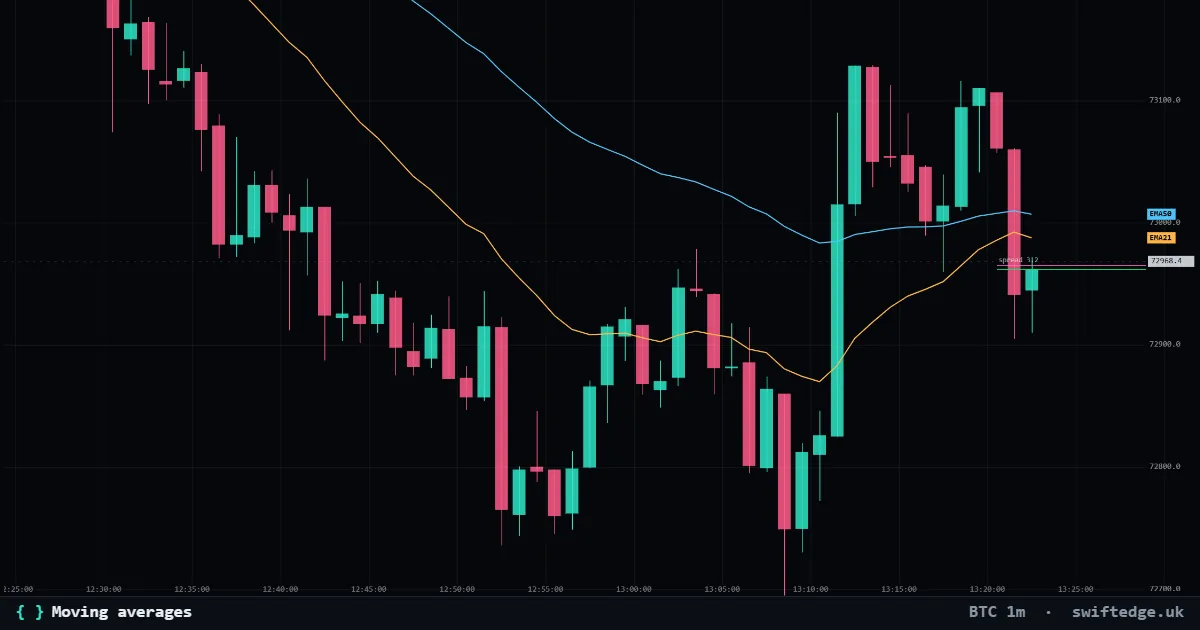
Up to three simple, exponential or weighted moving averages of the close.
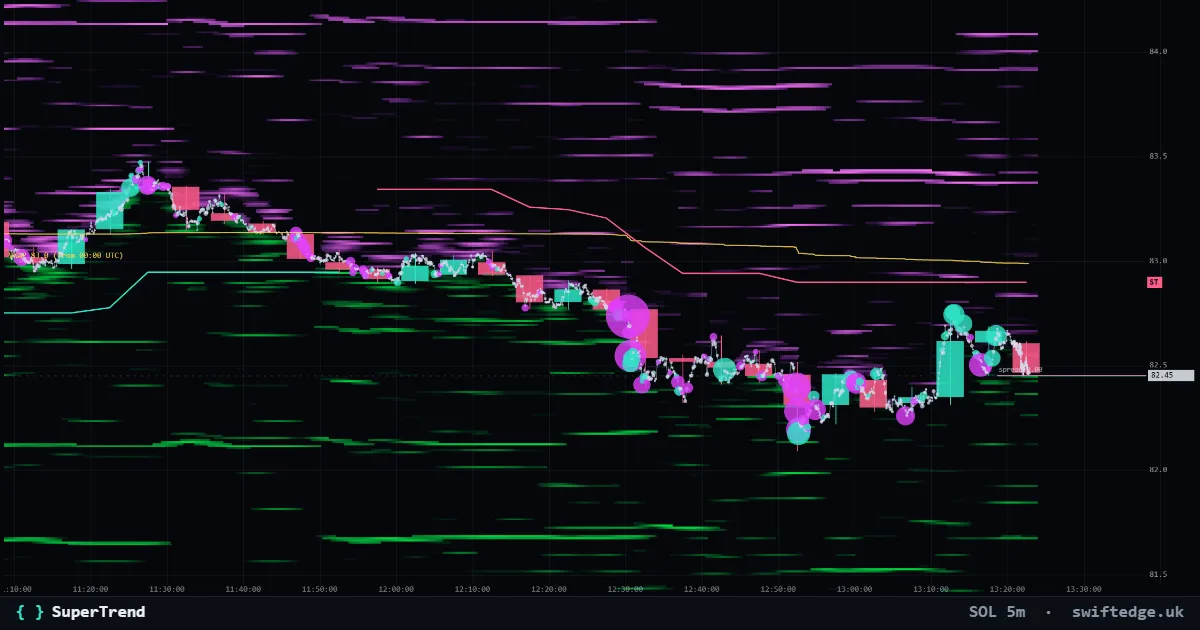
An ATR trailing line under price in uptrends and over price in downtrends; it flips when a candle closes through it.