Community scripts › Built into Depth › Donchian Channels
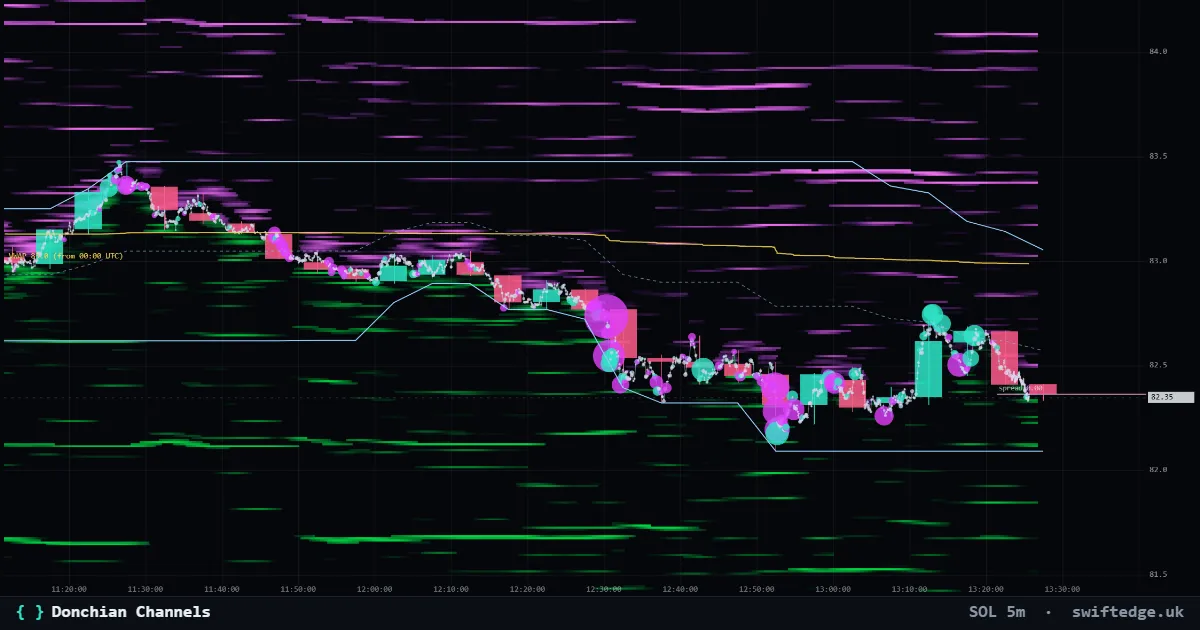
What it shows
The highest high and lowest low of the last N candles, and their middle.
How to read it
A new high above the upper line is a breakout of the last N candles' range.
How it's calculated
The upper line is the highest high of the last 20 candles, the lower line the lowest low, and the middle line sits halfway between them. The lines only move when a new high or low enters the window or an old one drops out, which gives the channel its stepped look.
What it can't tell you
A new 20-candle high is a fact about the last 20 candles only. On a short timeframe that can be a small move.
Donchian Channels on 9 markets right now
| Market | Price | High / middle / low | Reading | |
|---|---|---|---|---|
| Bitcoin | 72,070 | 74,778 / 73,246 / 71,714 | This candle made a new 20-candle low | Open chart › |
| Gold | 3,899.33 | 4,003.12 / 3,944.94 / 3,886.77 | This candle made a new 20-candle low | Open chart › |
| Ethereum | 2,012 | 2,084 / 2,026 / 1,967 | Price in the middle third of the 20-candle range | Open chart › |
| Solana | 81.47 | 85.12 / 82.76 / 80.40 | This candle made a new 20-candle low | Open chart › |
| XRP | 1.0303 | 1.0680 / 1.0434 / 1.0187 | This candle made a new 20-candle low | Open chart › |
| US 500 | 7,590.40 | 7,641.53 / 7,594.51 / 7,547.50 | Price in the middle third of the 20-candle range | Open chart › |
| US 100 | 28,241.2 | 28,556.5 / 28,230.6 / 27,904.8 | Price in the middle third of the 20-candle range | Open chart › |
| Silver | 50.451 | 51.988 / 51.068 / 50.147 | Price in the lower third of the 20-candle range | Open chart › |
| WTI crude oil | 85.39 | 86.71 / 85.46 / 84.20 | Price in the middle third of the 20-candle range | Open chart › |
Settings in Depth
| Timeframe | the chart's timeframe (or a fixed 1m to 1D) |
| Length | 20 |
FAQ
What does 'a new 20-candle high' in the table mean?
The current 1h candle has traded at or above the highest high of the previous 20 hours, so it touches the upper line.
Why is the middle line useful?
It is the midpoint of the recent range, so it shows at a glance whether price trades in the upper or the lower half.
Can I use a longer channel?
Yes, the length goes from 2 to 300 candles.
More in Classic indicators
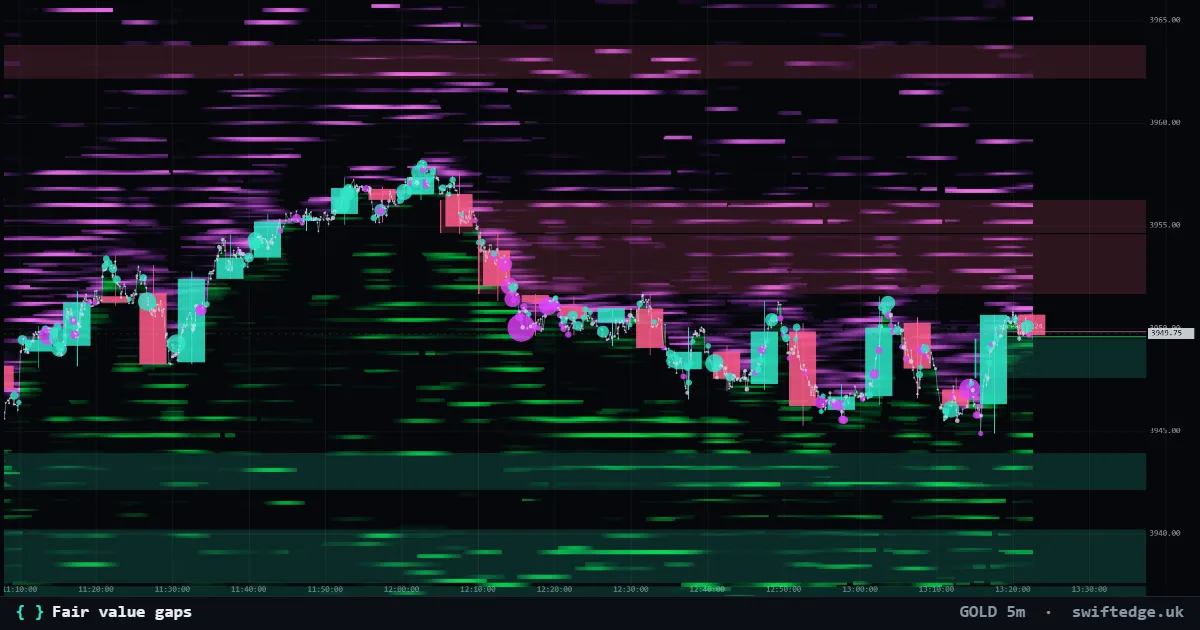
Three-candle gaps where price moved too fast to trade both ways; shown until price fills them.
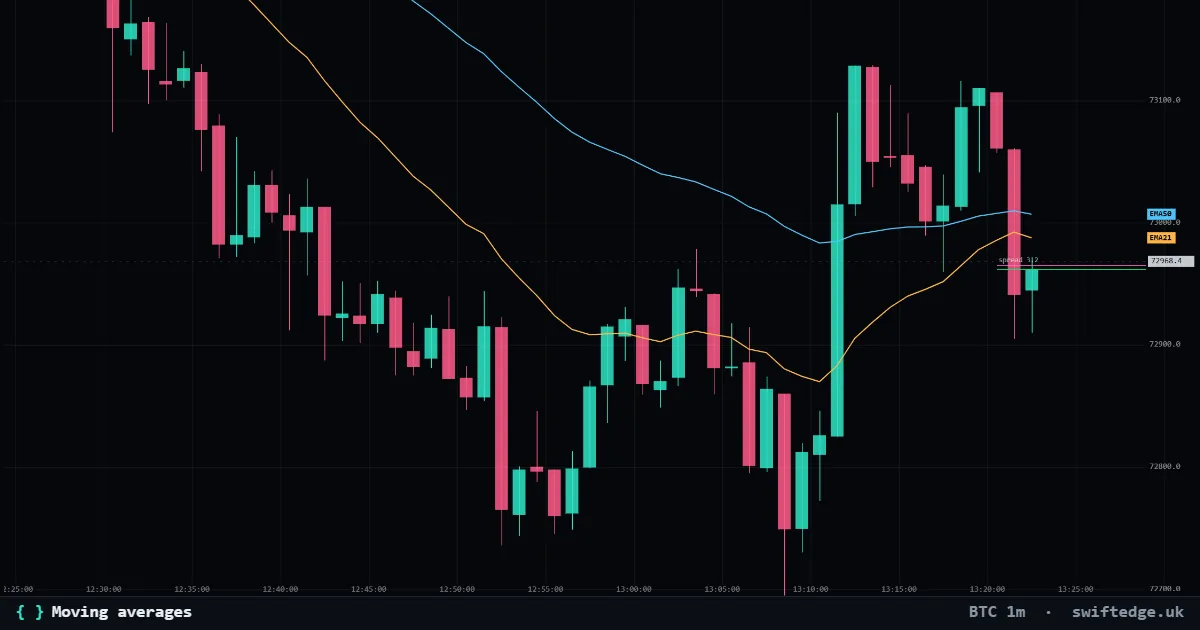
Up to three simple, exponential or weighted moving averages of the close.
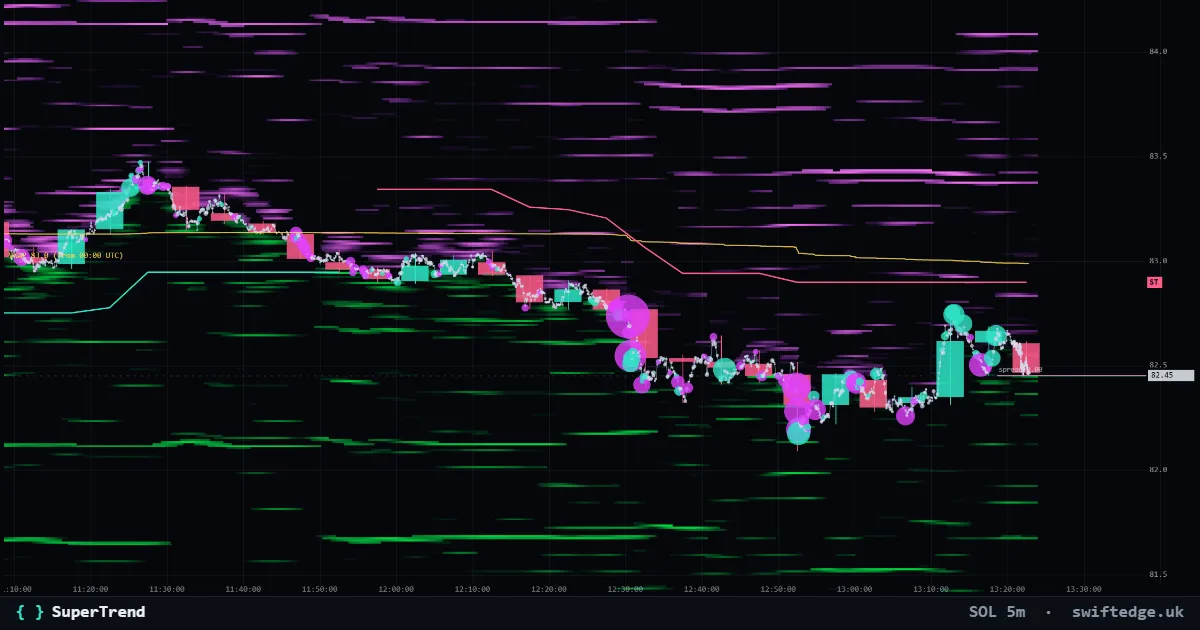
An ATR trailing line under price in uptrends and over price in downtrends; it flips when a candle closes through it.