Community scripts › Built into Depth › Candle stats (volume & delta)
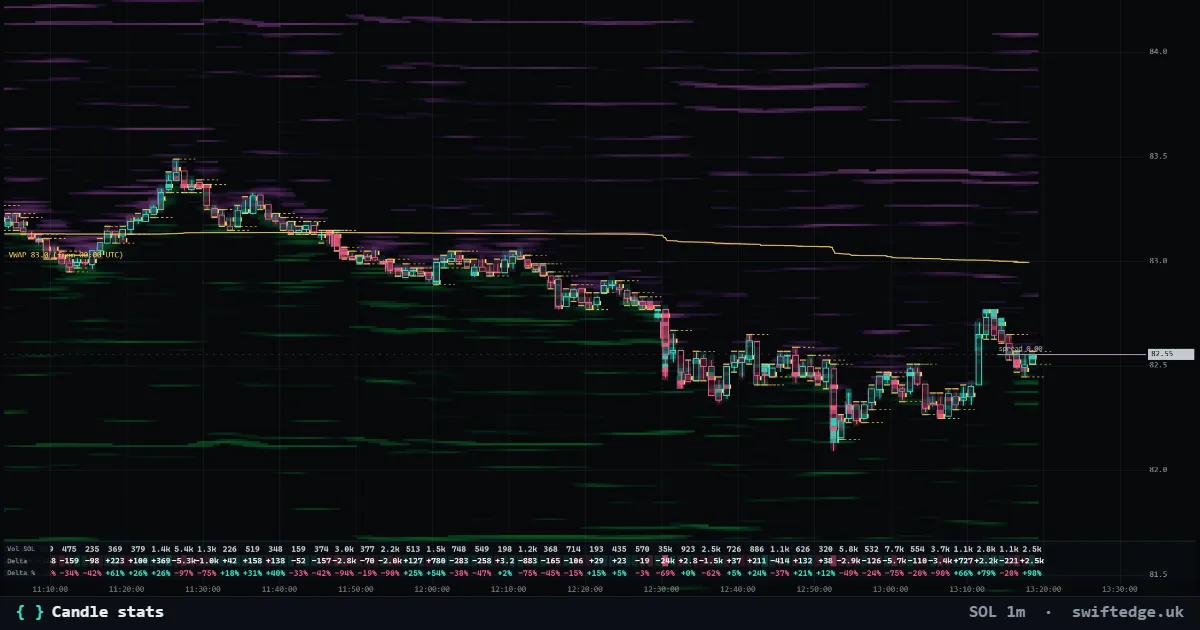
What it shows
The footprint's stats table under normal candles: volume, delta and delta % for every candle, optionally buy, sell and cumulative delta, in coin or USD.
How to read it
Delta = aggressive buying minus aggressive selling in the candle; delta % = delta / volume. The numbers are the same as in the footprint's table (same trades). A big up candle with negative delta means price rose while sellers hit bids: absorption or a squeeze. Works on candles from 5 seconds up. Zoom in to see the numbers; zoomed out, the colors show volume and delta. Drag the table's top edge to resize it, or minimize it.
How it's calculated
Under normal candles Depth shows the footprint's stats table: volume, delta (aggressive buying minus aggressive selling) and delta % (delta divided by volume) for every candle, optionally buy and sell volume and cumulative delta, in the market's unit or in USD. The numbers come from the same trades as the footprint chart.
What it can't tell you
Delta tells who was aggressive inside the candle, not who was right. A big up candle with negative delta can be absorption or a squeeze.
Settings in Depth
| Volume | on |
| Delta | on |
| Delta % | on |
| Buy and sell | off |
| Cumulative delta (from the left edge) | off |
FAQ
What is delta?
Aggressive buying minus aggressive selling in the candle.
Why can a green candle have negative delta?
Price rose while sellers kept hitting the bids: passive buyers absorbed them, or shorts were forced out.
Which candle sizes does it work on?
From 5-second candles up; zoom in to read the numbers.
More in Order flow
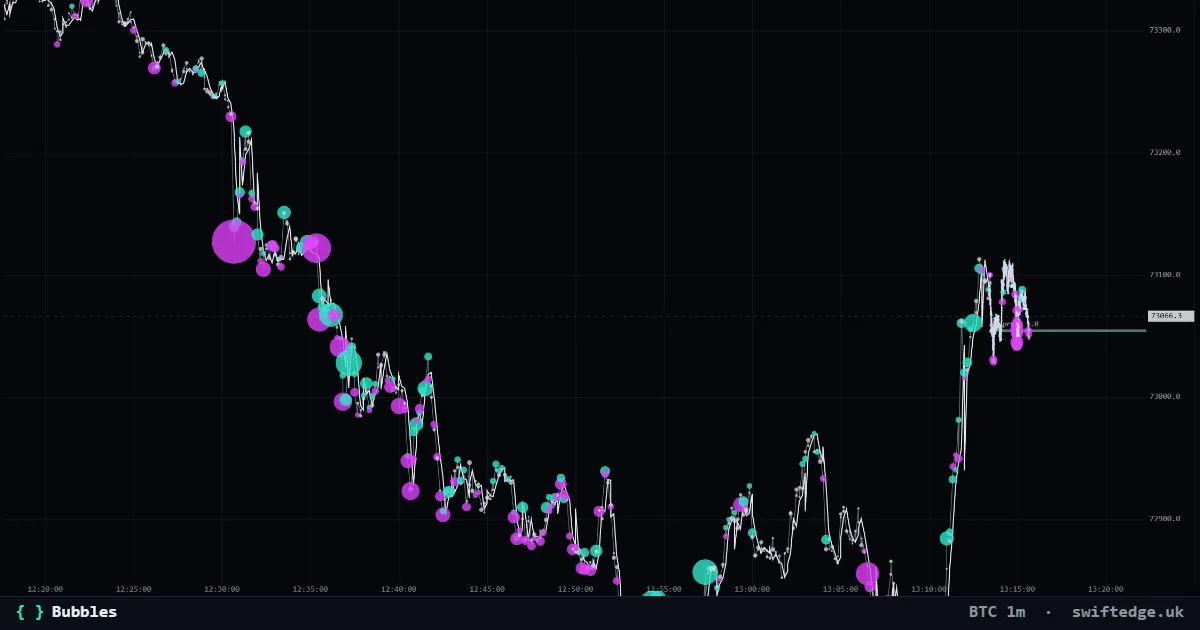
Every trade as a bubble: teal for aggressive buys, violet for aggressive sells; the size is the volume.
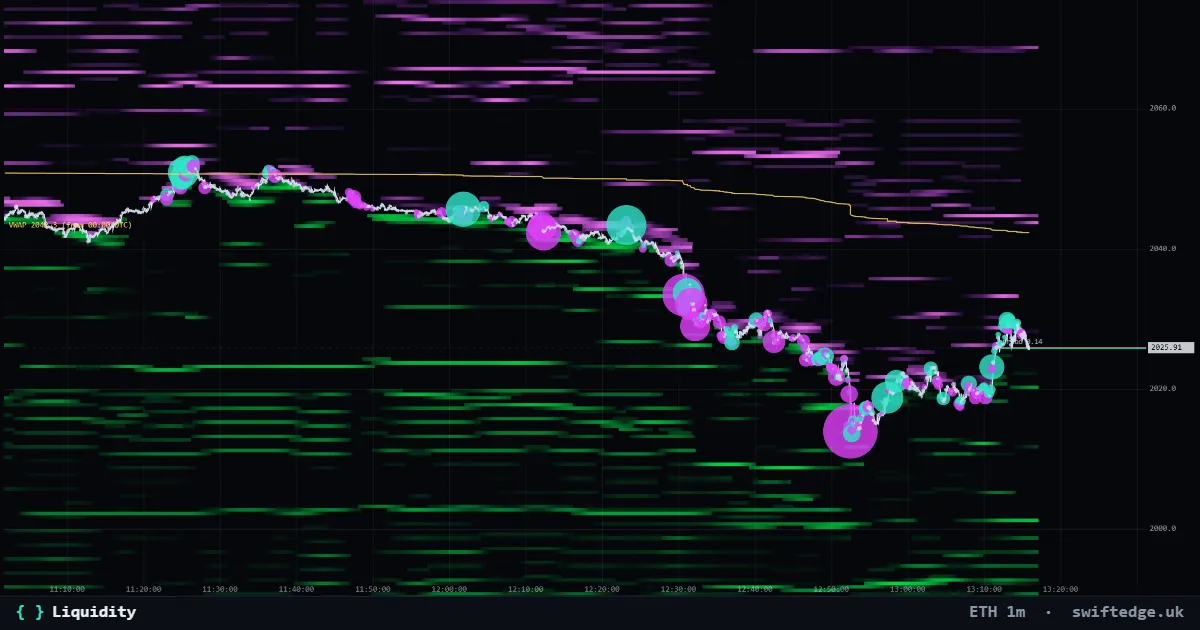
Resting limit orders in the order book by price and time: green bids below price, violet asks above. Brighter means more size.
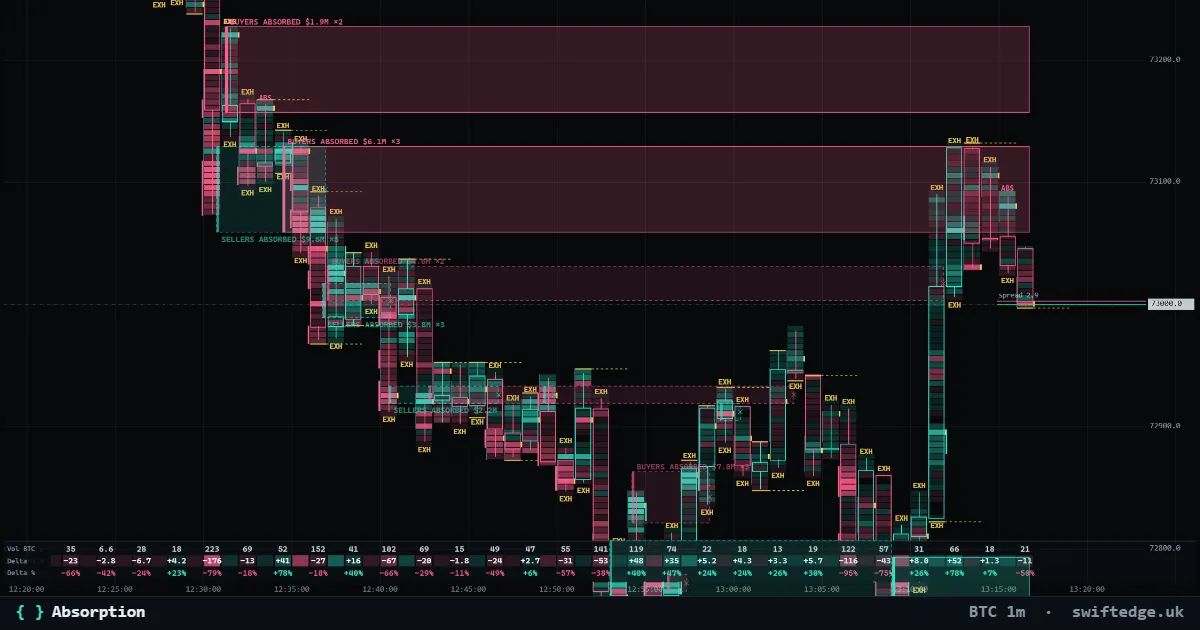
Zones where heavy aggressive selling (or buying) hit a price level and price did not get through; the zone runs until price trades past it.