Community scripts › Built into Depth › Stacked imbalance zones
Stacked imbalance zones
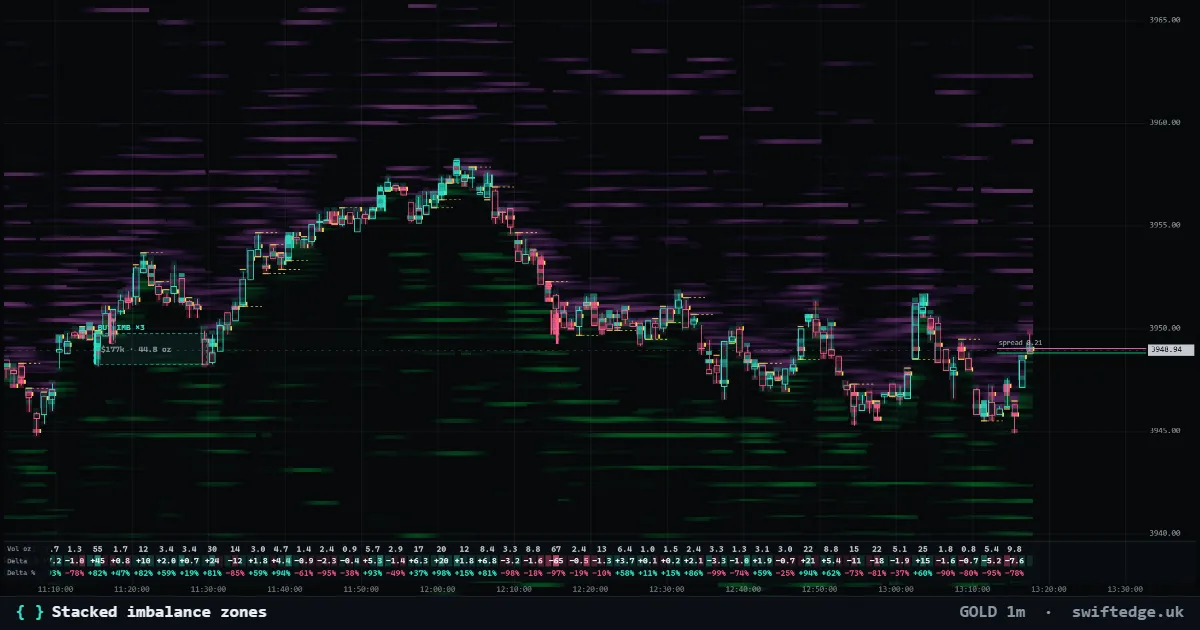
Stacked buy or sell imbalances from the footprint, kept on the chart as zones where one side overwhelmed the other.
What it shows
Zones where aggressive buyers (or sellers) outweighed the other side several times over on several price levels in a row.
How to read it
Compared diagonally like a footprint chart: buying at one price against selling one level below. Three or more in a row form a zone that extends until price trades through it.
How it's calculated
Like a footprint chart, Depth compares aggressive buying at one price with aggressive selling one level below (diagonally). When one side outweighs the other by 3x or more on three or more levels in a row, within 15-second windows, the levels form a stacked imbalance zone that runs until price trades through it.
What it can't tell you
An imbalance shows one-sided aggressive flow at a moment. It does not show the resting orders that may meet it later.
Settings in Depth
| Time window (seconds) | 15 |
| Price step (USD, BTC scale) | 5 |
| Imbalance ratio (x) | 3 |
| Min. aggressive volume per level (40 = normal for this market) | 40 |
| Levels in a row (stacked) | 3 |
| Show zones from | the last 4 hours |
| From time of day (your clock, HH:MM) | 08:00 |
FAQ
Why compare diagonally?
Because the best bid and the best ask are one level apart. Comparing buying at one price with selling one level below lines up the two sides of the spread, as footprint charts do.
What does 'stacked' mean?
Three or more neighboring price levels with the same one-sided imbalance.
Can I make it stricter?
Yes: raise the ratio, the minimum volume per level or the number of levels in a row.
More in Order flow
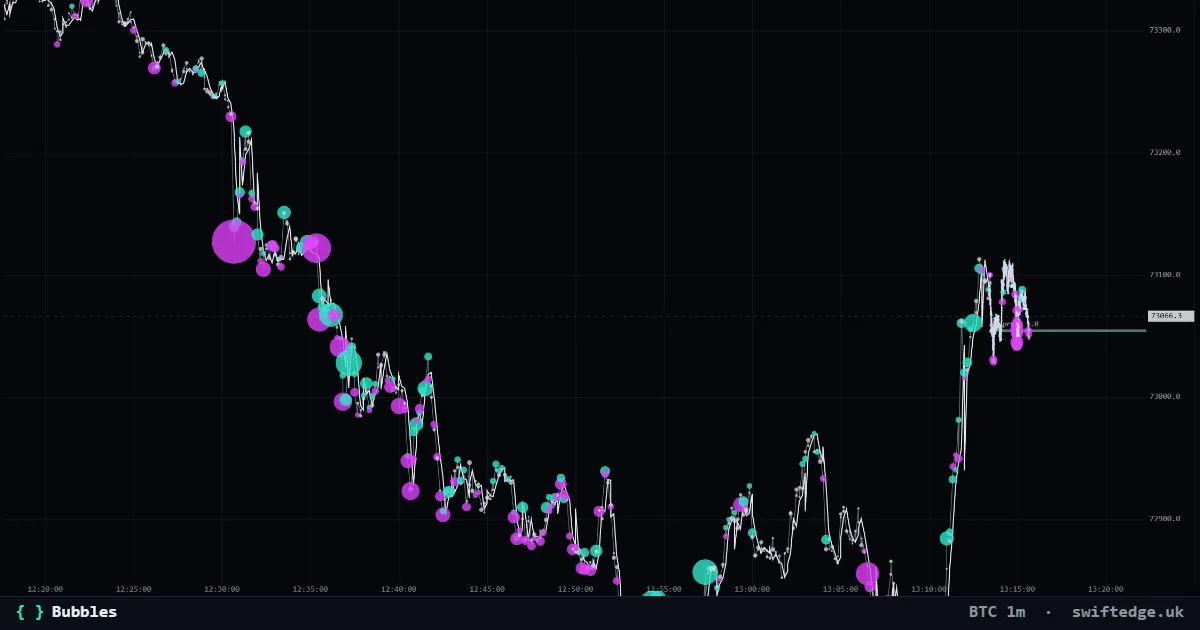
Every trade as a bubble: teal for aggressive buys, violet for aggressive sells; the size is the volume.
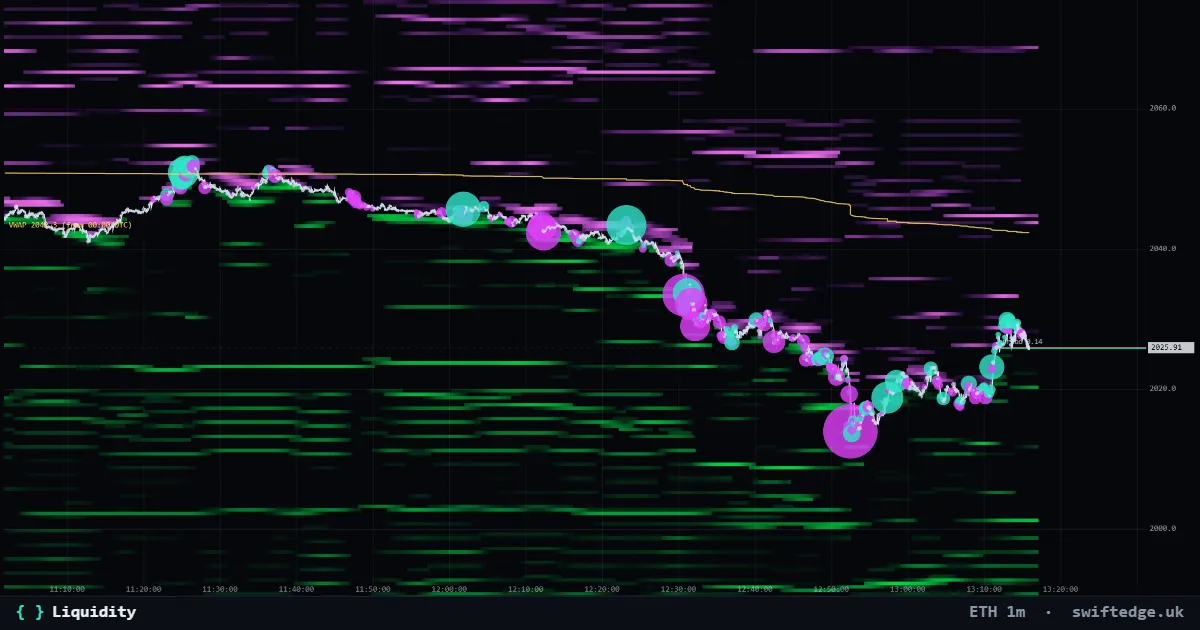
Resting limit orders in the order book by price and time: green bids below price, violet asks above. Brighter means more size.
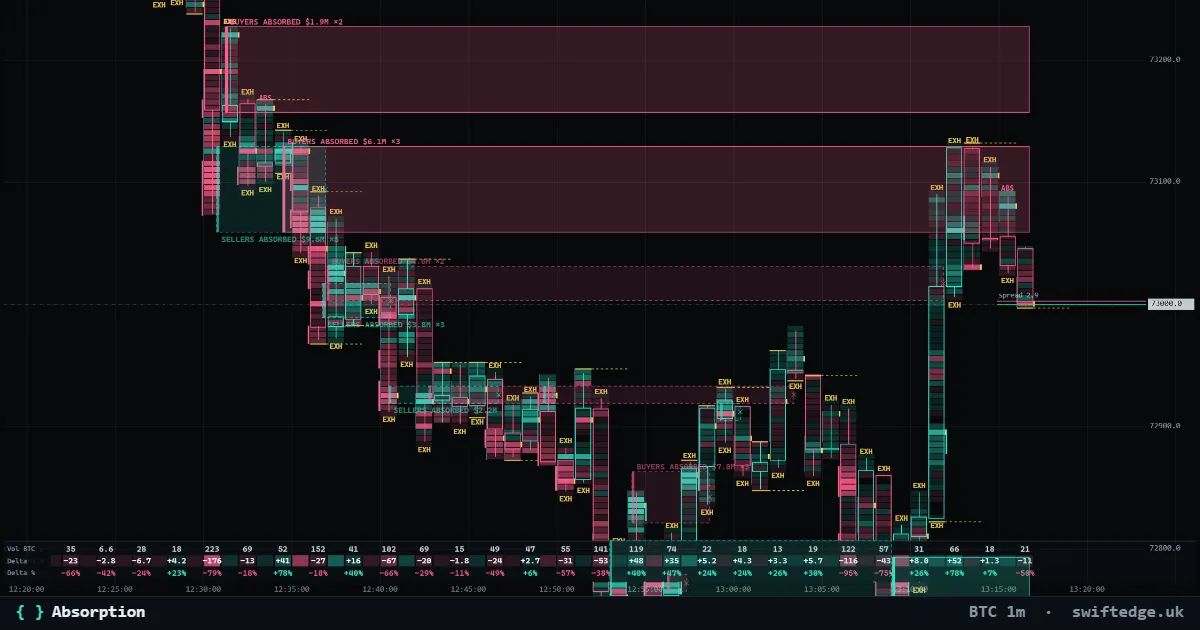
Zones where heavy aggressive selling (or buying) hit a price level and price did not get through; the zone runs until price trades past it.