Community scripts › Built into Depth › CCI
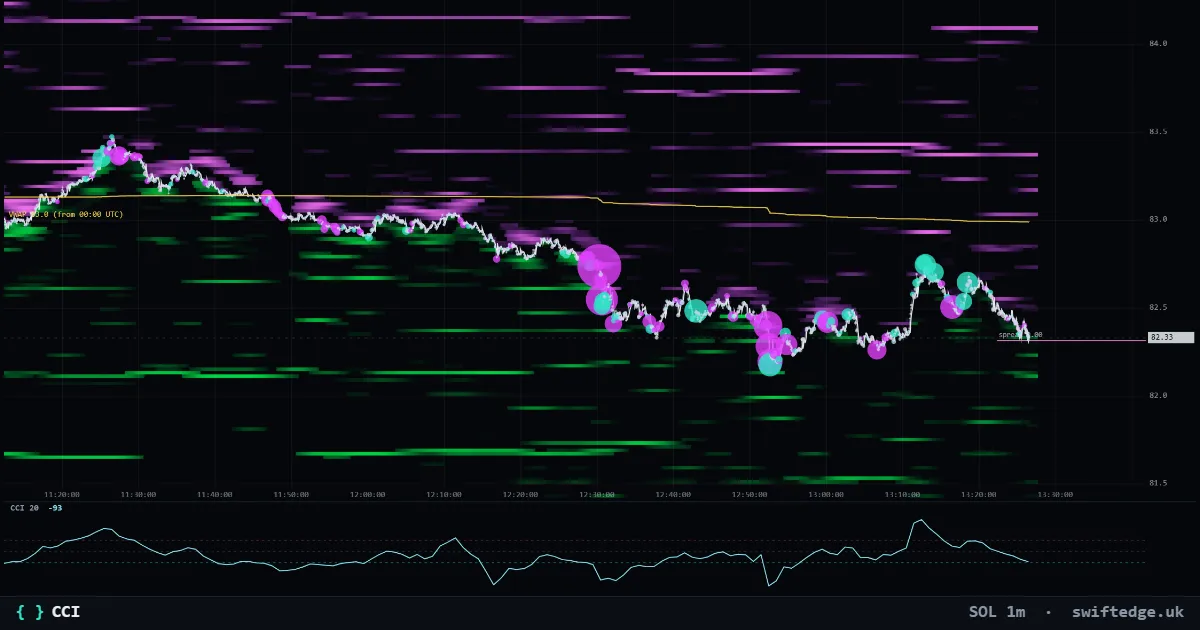
What it shows
Commodity channel index in a pane: distance from the average typical price in mean deviations.
How to read it
Part of Swiftedge Plus: it runs in Depth on the real trades and order book, with its own settings. Members turn it on under Indicators; the guide explains every setting.
How it's calculated
CCI takes the typical price (high + low + close) / 3, subtracts its 20-candle average and divides by 0.015 times the mean absolute deviation. The constant 0.015 is chosen so that most values fall between -100 and +100.
What it can't tell you
CCI has no upper or lower limit, and values beyond ±100 are common in trends.
CCI on 9 markets right now
| Market | Price | CCI 20 | Reading | |
|---|---|---|---|---|
| Bitcoin | 72,070 | -228 | CCI below -100 | Open chart › |
| Gold | 3,899.33 | -196 | CCI below -100 | Open chart › |
| Ethereum | 2,012 | -200 | CCI below -100 | Open chart › |
| Solana | 81.47 | -199 | CCI below -100 | Open chart › |
| XRP | 1.0303 | -171 | CCI below -100 | Open chart › |
| US 500 | 7,590.40 | -55 | CCI between -100 and 100 | Open chart › |
| US 100 | 28,241.2 | -15 | CCI between -100 and 100 | Open chart › |
| Silver | 50.451 | -203 | CCI below -100 | Open chart › |
| WTI crude oil | 85.39 | 45 | CCI between -100 and 100 | Open chart › |
Settings in Depth
| Timeframe | the chart's timeframe (or a fixed 1m to 1D) |
| Length | 20 |
FAQ
Why is CCI sometimes above 200?
CCI has no fixed range. A fast move away from the average typical price pushes it far beyond ±100.
What is the typical price?
The average of the candle's high, low and close.
Can I change the length?
Yes, from 2 to 200 candles.
More in Classic indicators
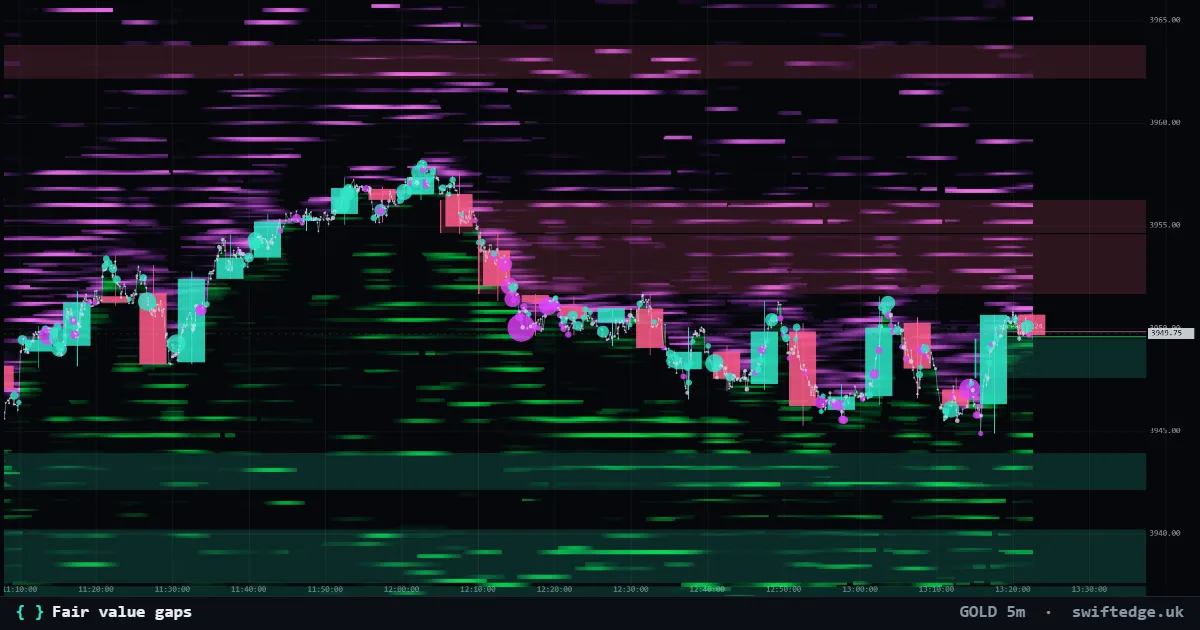
Three-candle gaps where price moved too fast to trade both ways; shown until price fills them.
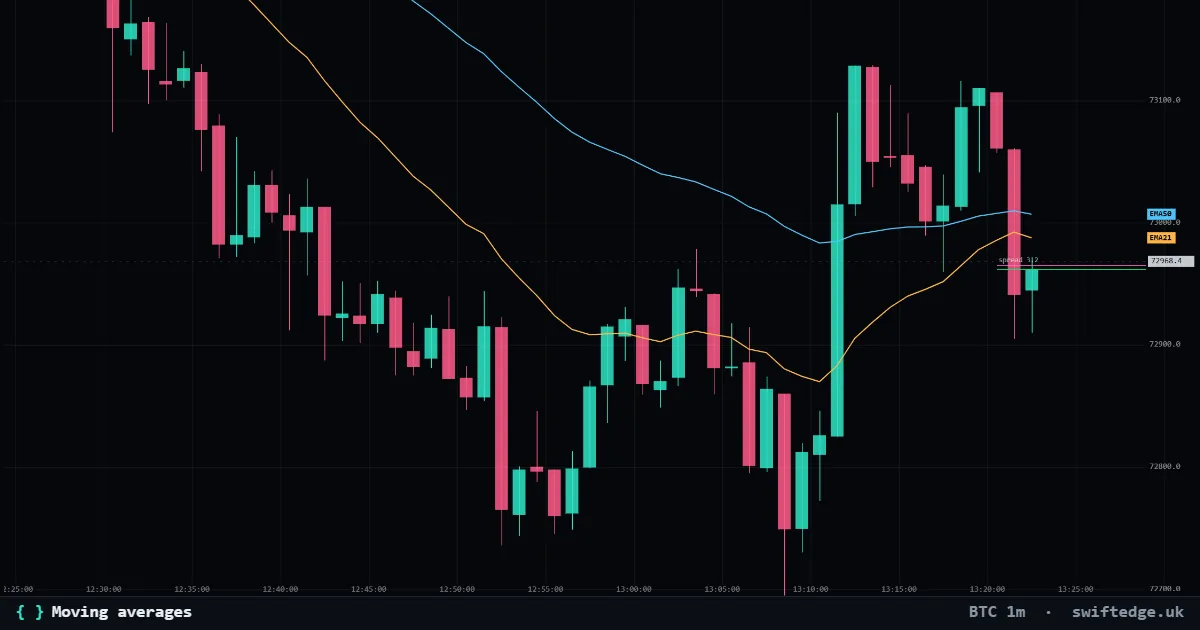
Up to three simple, exponential or weighted moving averages of the close.
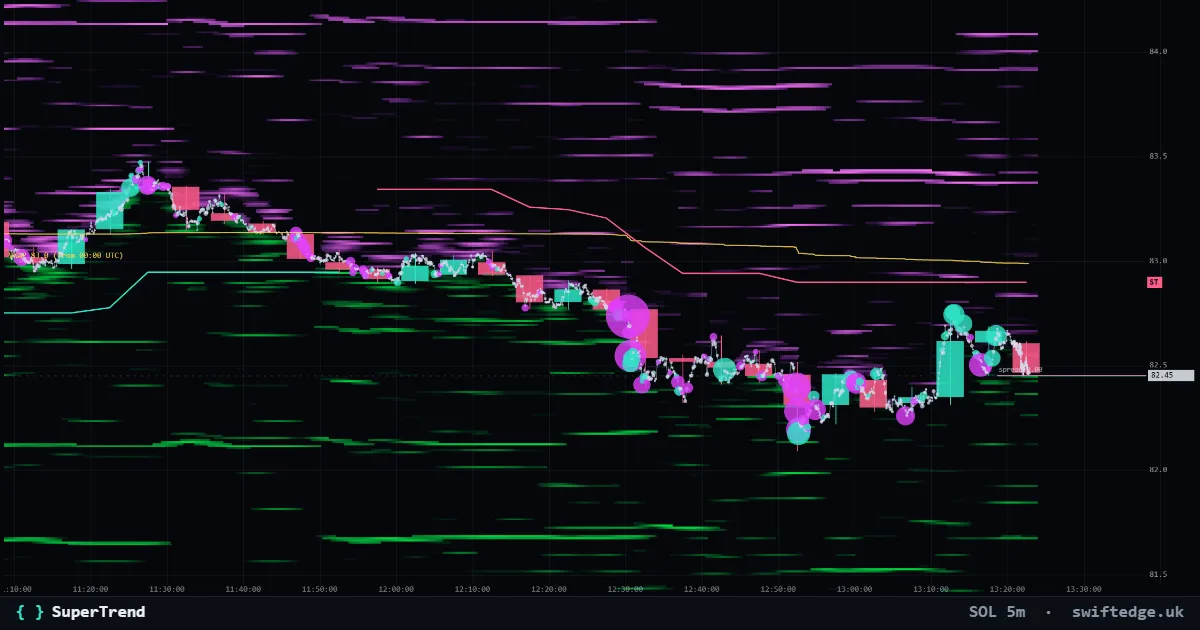
An ATR trailing line under price in uptrends and over price in downtrends; it flips when a candle closes through it.