Swiftedge Depth · gold
Free live gold footprint chart
A footprint chart splits every candle into price rows and shows how many ounces were sold and how many were bought at each one. Swiftedge Depth builds it live from every trade in the Binance XAUUSDT perpetual (one contract is one troy ounce) and draws it over the gold order book heatmap. Free, in the browser, no sign-up.
Open the live gold footprint.One-minute candles to start; switch the timeframe in the top bar.
Gold footprint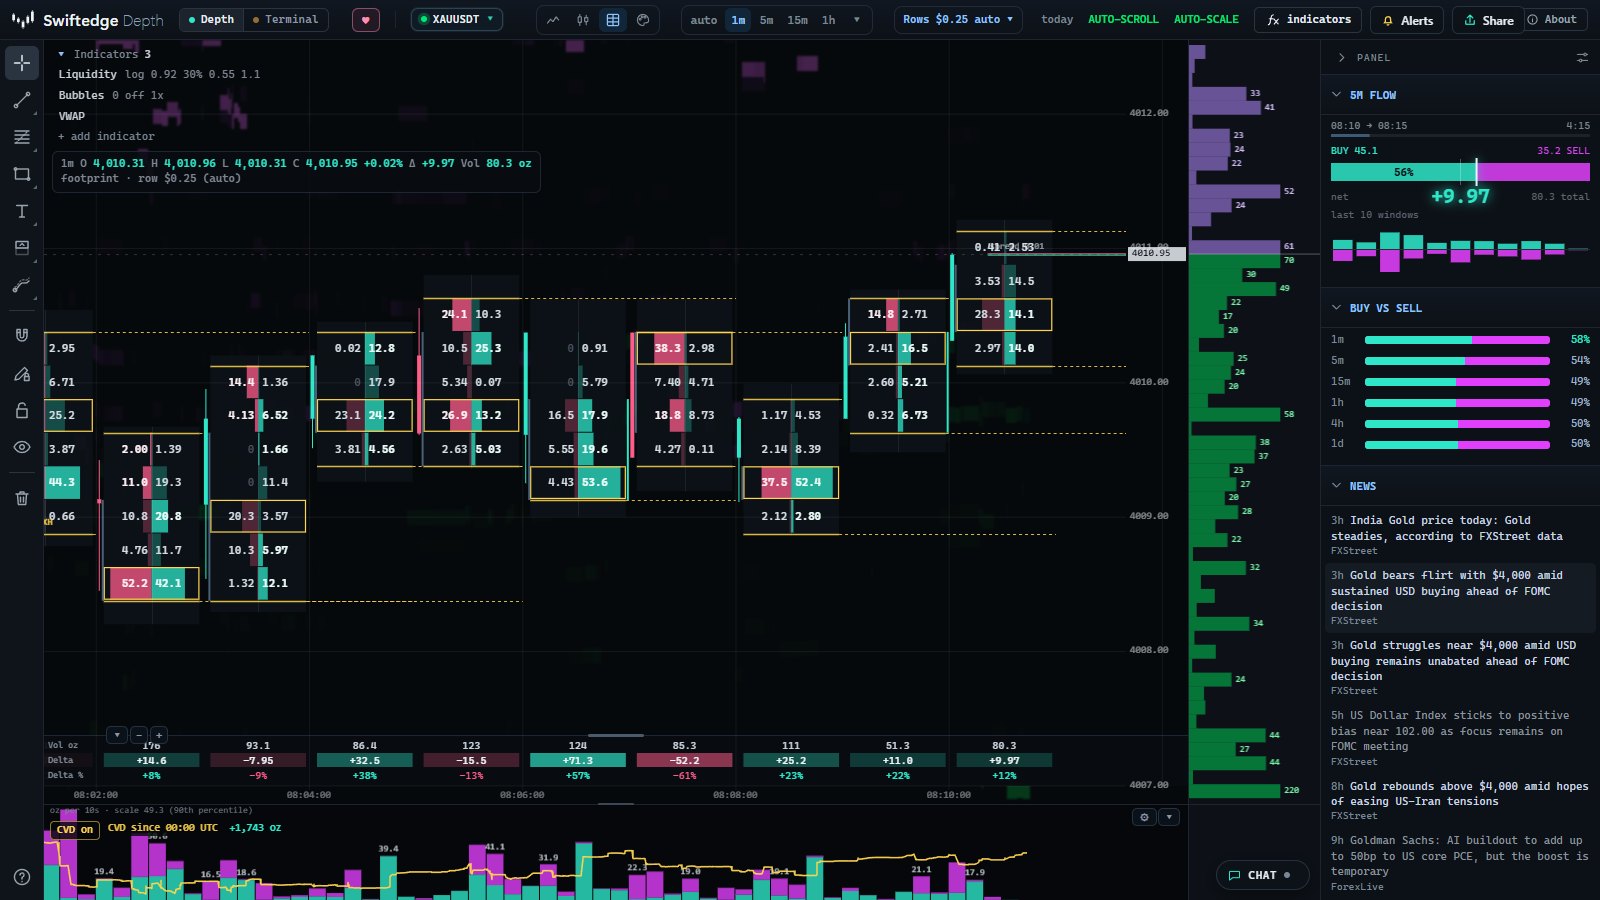
What it shows on gold
Inside each candle, every row has two numbers in ounces: on the left gold sold into the bid at that price, on the right gold bought from the ask. A bar behind each number grows out from the middle of the cell, so the busiest prices catch the eye first. Below the chart, a table lists each candle's volume, its delta (bought minus sold) and delta as a share of volume.
- Diagonal imbalances: buying at one price is compared with selling one row lower. When one side is at least three times the other (300 %), the number is highlighted, teal for buyers and pink for sellers. Three or more in a row form a stacked imbalance and get a bar along the edge of the candle.
- Point of control (POC): the row where the most gold changed hands in each candle has a yellow frame.
- Rows in dollars: rows follow the zoom; at the default zoom they are about $0.25 apart, and you can fix them in the timeframe menu. Prices keep two decimals.
Gold footprints and the clock
Gold's volume is not spread evenly over the day, so the same footprint means more at some hours than at others. From 15 September to 27 October 2026 (Binance XAUUSDT, n = 999 hourly candles, US summer time throughout):
| Hours (UTC) | What happens | Share of weekday volume |
|---|---|---|
| 00:00-07:00 | Asia | 27.6 % |
| 07:00-12:00 | London morning, LBMA morning auction (10:30 London) | 18.7 % |
| 12:00-17:00 | COMEX open (08:20 New York) and US data, LBMA afternoon auction | 37.1 % |
| 17:00-21:00 | COMEX settlement (13:30 New York) and the US afternoon | 13.1 % |
| 22:00-24:00 | After the daily break | 3.5 % |
The daily break (21:00-22:00 UTC in US summer time, 22:00-23:00 UTC in winter) averaged 16 % of an open hour's volume, and an hour of the weekend close 8.4 %. On a quiet footprint, a 300 % imbalance can come from a handful of ounces, so compare it with the volume column before reading anything into it. Gold trading sessions shows the times in your time zone, and how to read gold order flow goes through the rest of the measurements.
How to read it
Start with each candle's delta, find the point of control, look for imbalances and stacked imbalances, check the edges of the candle for thin trading, and compare the numbers with the ounces resting in the heatmap behind them. The step-by-step walk-through with examples is on the footprint chart page, and stacked imbalance zones are covered in the stacked imbalance guide.
Open gold candles with imbalance zones
Everything else for gold
- Gold order book heatmap: the resting liquidity behind the footprint, and how to read it.
- Gold liquidations today, the gold liquidation heatmap and gold whale trades.
- Gold levels today, gold funding rate and gold open interest.
What it can't tell you
The footprint records trading that already happened on one venue, the Binance XAUUSDT perpetual. It leaves out spot gold, COMEX futures and other venues, and says nothing about where the price goes next. It is a precise record of who traded where, not a signal.
Common questions
Is there a free gold footprint chart?
Yes. Swiftedge Depth draws a live footprint chart for XAUUSDT in the browser, free and without an account. Open gold in Depth and pick the footprint icon in the top bar, or use the button on this page.
Where does the gold footprint data come from?
Every trade in the Binance XAUUSDT perpetual, with the exchange's own aggressor side, so the split between buying and selling at each price is measured, not estimated. It is one venue and a perpetual, not spot gold or COMEX.
What are the numbers in the cells?
Ounces. One XAUUSDT contract is one troy ounce, so the left number in a cell is ounces sold into the bid at that price and the right number ounces bought from the ask. Price rows are in US dollars and follow the zoom.
Why are many cells empty at the weekend?
Spot gold is closed from Friday 17:00 to Sunday 18:00 New York time. The perpetual still trades, but in our measurement a weekend hour had about a twelfth of the volume of an open hour, so most rows stay empty and single trades decide the imbalances. Read weekend footprints with that in mind.