Community scripts › Built into Depth › Moving averages
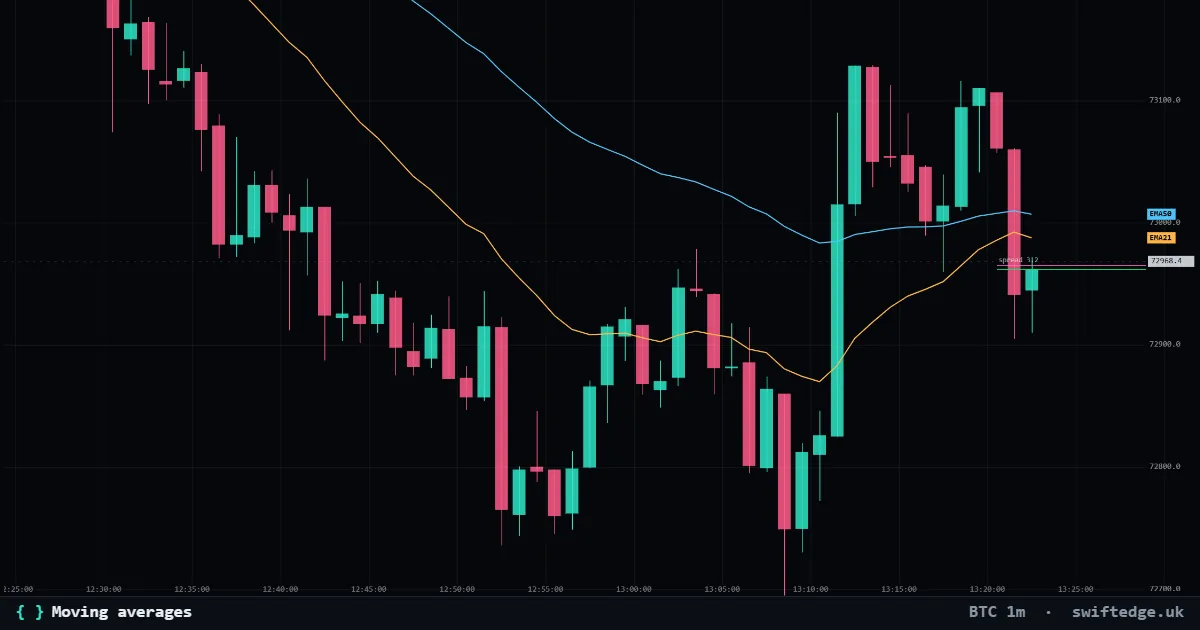
What it shows
Up to three simple, exponential or weighted moving averages of the close.
How to read it
A moving average smooths the close over N candles. Exponential and weighted versions react faster to recent prices.
How it's calculated
Depth draws up to three moving averages of the close. By default line 1 is an EMA 21, line 2 an EMA 50 and line 3 an SMA 200. A simple average (SMA) weights every close in the window equally; an exponential one (EMA) weights recent closes more, so it turns sooner; a weighted one (WMA) weights them linearly. Each line is calculated on the chart's timeframe, with enough history in front of the visible window that even the 200-candle average is complete.
What it can't tell you
An average only describes where price has been. It lags by design, and in a sideways market price crosses it again and again without anything following from it.
Moving averages on 9 markets right now
| Market | Price | Averages | Reading | |
|---|---|---|---|---|
| Bitcoin | 72,070 | EMA 21 73,380 · EMA 50 73,779 · SMA 200 75,743 | Price below all three | Open chart › |
| Gold | 3,899.33 | EMA 21 3,962.79 · EMA 50 4,002.02 · SMA 200 4,065.55 | Price below all three | Open chart › |
| Ethereum | 2,012 | EMA 21 2,043 · EMA 50 2,063 · SMA 200 2,194 | Price below all three | Open chart › |
| Solana | 81.47 | EMA 21 82.91 · EMA 50 83.71 · SMA 200 88.35 | Price below all three | Open chart › |
| XRP | 1.0303 | EMA 21 1.0463 · EMA 50 1.0588 · SMA 200 1.1517 | Price below all three | Open chart › |
| US 500 | 7,590.40 | EMA 21 7,585.83 · EMA 50 7,569.70 · SMA 200 7,497.05 | Price above all three | Open chart › |
| US 100 | 28,241.2 | EMA 21 28,148.0 · EMA 50 28,056.9 · SMA 200 27,561.5 | Price above all three | Open chart › |
| Silver | 50.451 | EMA 21 51.321 · EMA 50 51.776 · SMA 200 52.203 | Price below all three | Open chart › |
| WTI crude oil | 85.39 | EMA 21 85.30 · EMA 50 85.66 · SMA 200 88.46 | Price above EMA 21; below EMA 50 and SMA 200 | Open chart › |
Settings in Depth
| Timeframe | the chart's timeframe (or a fixed 1m to 1D) |
| Line 1 type | EMA |
| Line 1 length | 21 |
| Line 2 type | EMA |
| Line 2 length (0 = off) | 50 |
| Line 3 type | SMA |
| Line 3 length (0 = off) | 200 |
FAQ
What is the difference between an SMA and an EMA?
An SMA gives every close in the window the same weight. An EMA gives recent closes more weight, so it reacts faster to a new move and lags less.
Why are 21, 50 and 200 the defaults?
They are widely watched lengths: a short, a medium and a long average. You can change the type and length of each line, or switch lines 2 and 3 off by setting their length to 0.
Does the last point of the average move during the hour?
Yes. The average includes the candle that is still forming, so its last point follows price until the candle closes.
More in Classic indicators
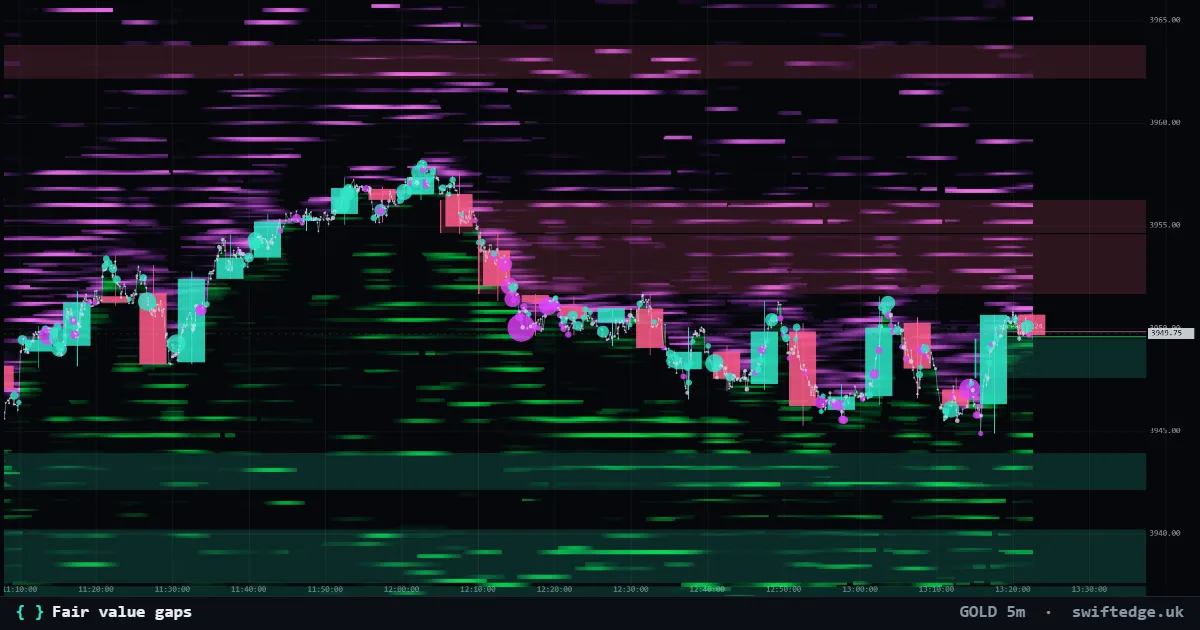
Three-candle gaps where price moved too fast to trade both ways; shown until price fills them.
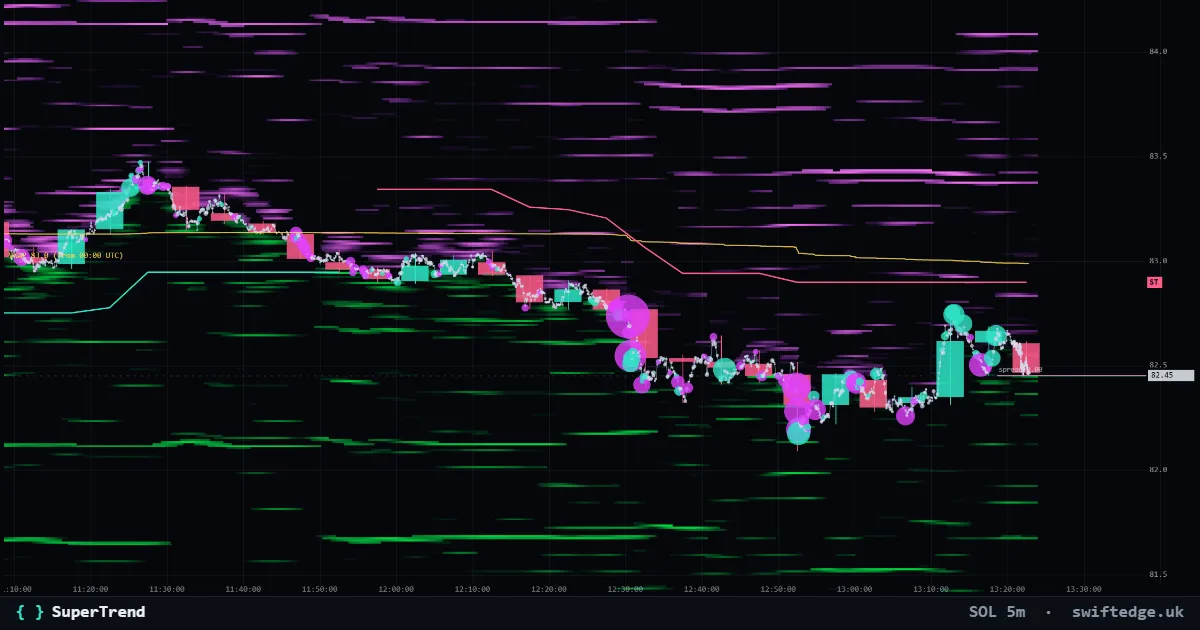
An ATR trailing line under price in uptrends and over price in downtrends; it flips when a candle closes through it.
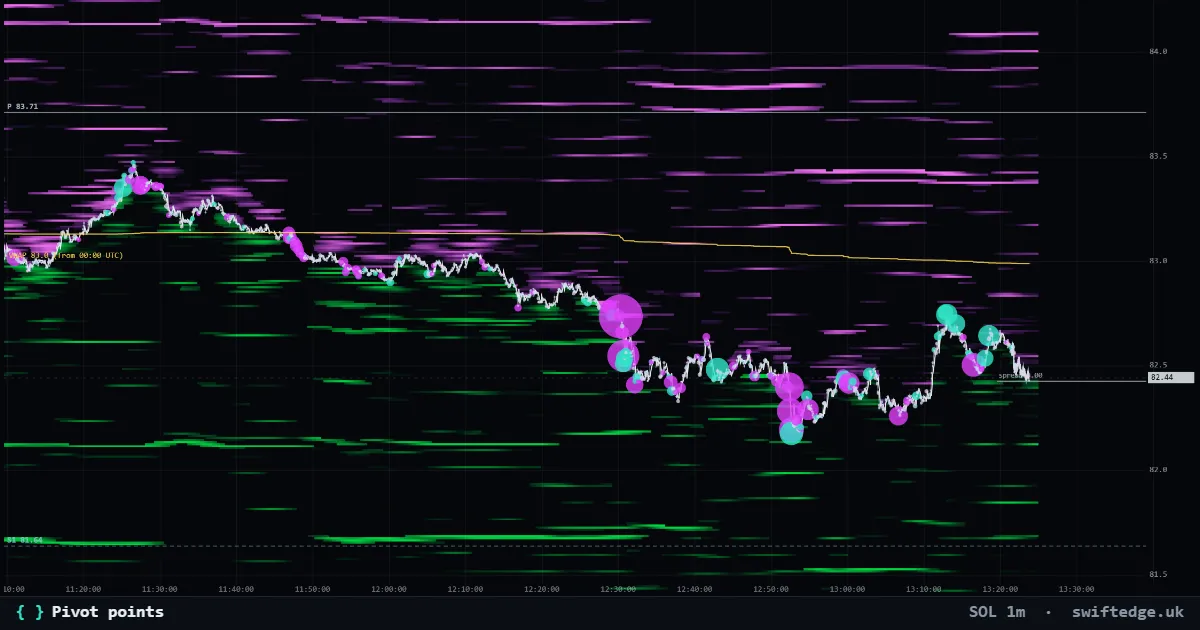
Classic, Fibonacci or Camarilla pivots from the previous day's or week's high, low and close.