Community scripts › Built into Depth › MFI
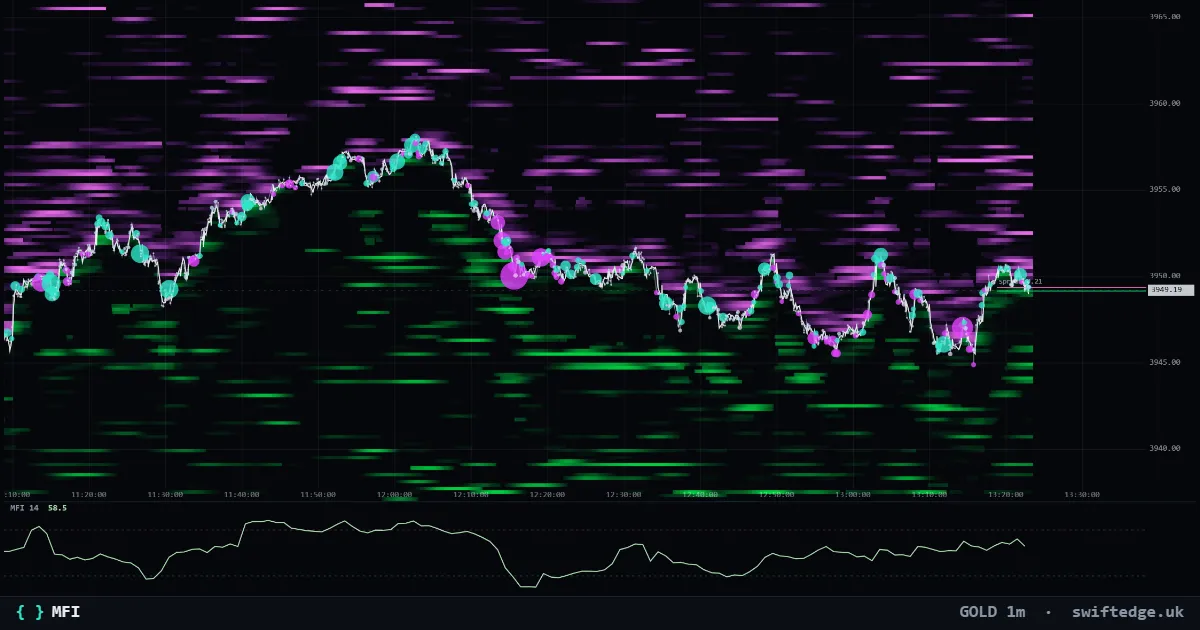
What it shows
Money flow index (0-100) in a pane: an RSI weighted by volume.
How to read it
Part of Swiftedge Plus: it runs in Depth on the real trades and order book, with its own settings. Members turn it on under Indicators; the guide explains every setting.
How it's calculated
MFI is RSI with volume. For each candle, money flow is the typical price times the volume; it counts as positive when the typical price rose from the previous candle and negative when it fell. MFI = 100 - 100 / (1 + positive flow / negative flow) over 14 candles.
What it can't tell you
MFI uses total volume, not who was aggressive, and it can stay above 80 or below 20 in strong trends.
MFI on 9 markets right now
| Market | Price | MFI 14 | Reading | |
|---|---|---|---|---|
| Bitcoin | 72,070 | 11.7 | MFI below 20 | Open chart › |
| Gold | 3,899.33 | 12.4 | MFI below 20 | Open chart › |
| Ethereum | 2,012 | 28.5 | MFI between 20 and 80 | Open chart › |
| Solana | 81.47 | 15.8 | MFI below 20 | Open chart › |
| XRP | 1.0303 | 20.2 | MFI between 20 and 80 | Open chart › |
| US 500 | 7,590.40 | 55.4 | MFI between 20 and 80 | Open chart › |
| US 100 | 28,241.2 | 53.7 | MFI between 20 and 80 | Open chart › |
| Silver | 50.451 | 24.1 | MFI between 20 and 80 | Open chart › |
| WTI crude oil | 85.39 | 59.0 | MFI between 20 and 80 | Open chart › |
Settings in Depth
| Timeframe | the chart's timeframe (or a fixed 1m to 1D) |
| Length | 14 |
FAQ
How is MFI different from RSI?
RSI uses closes only. MFI weights each move by its volume, so a move on heavy volume counts more.
What do 80 and 20 mean?
Money flow has been one-sided over the last 14 candles. The table reports the zone, not a signal.
Can I change the length?
Yes, from 2 to 100 candles.
More in Classic indicators
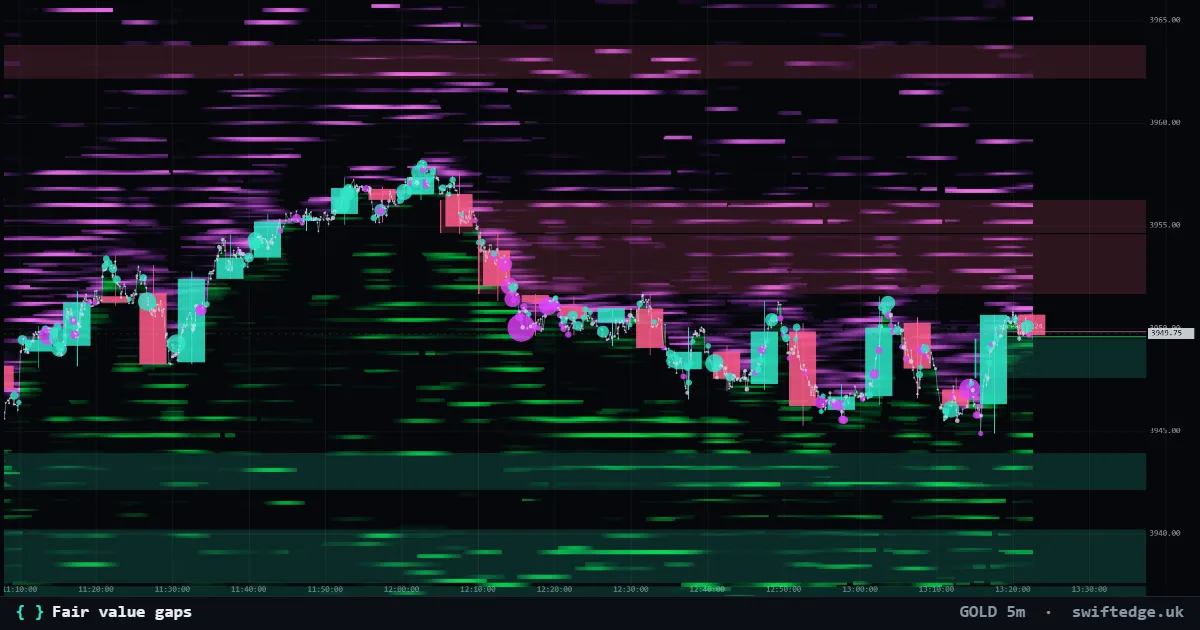
Three-candle gaps where price moved too fast to trade both ways; shown until price fills them.
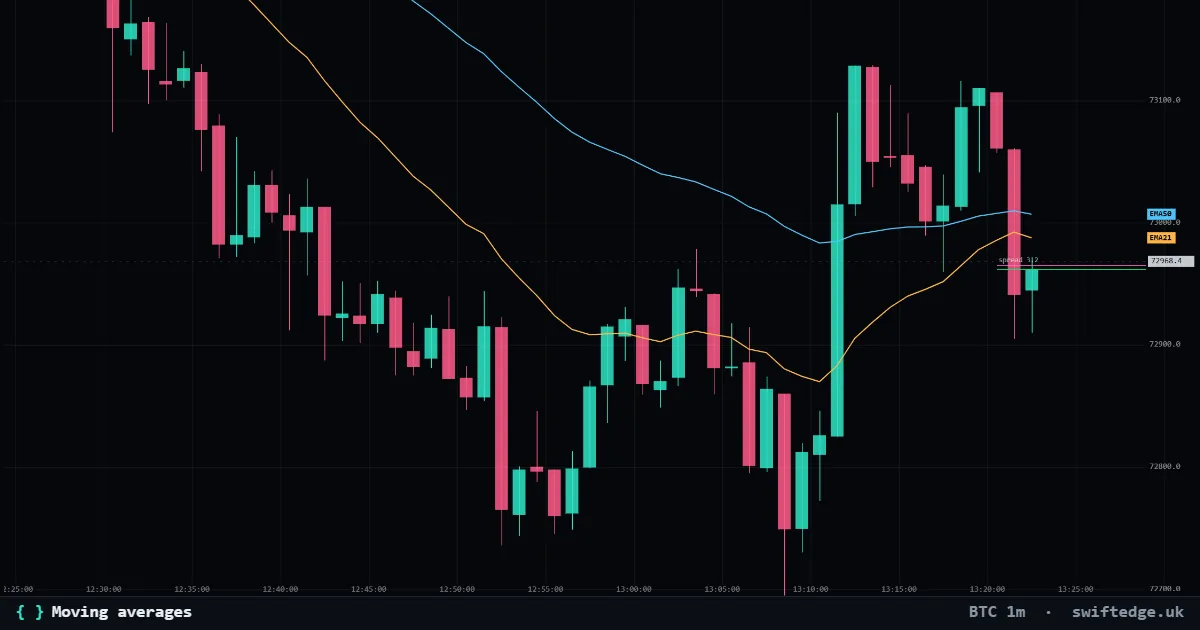
Up to three simple, exponential or weighted moving averages of the close.
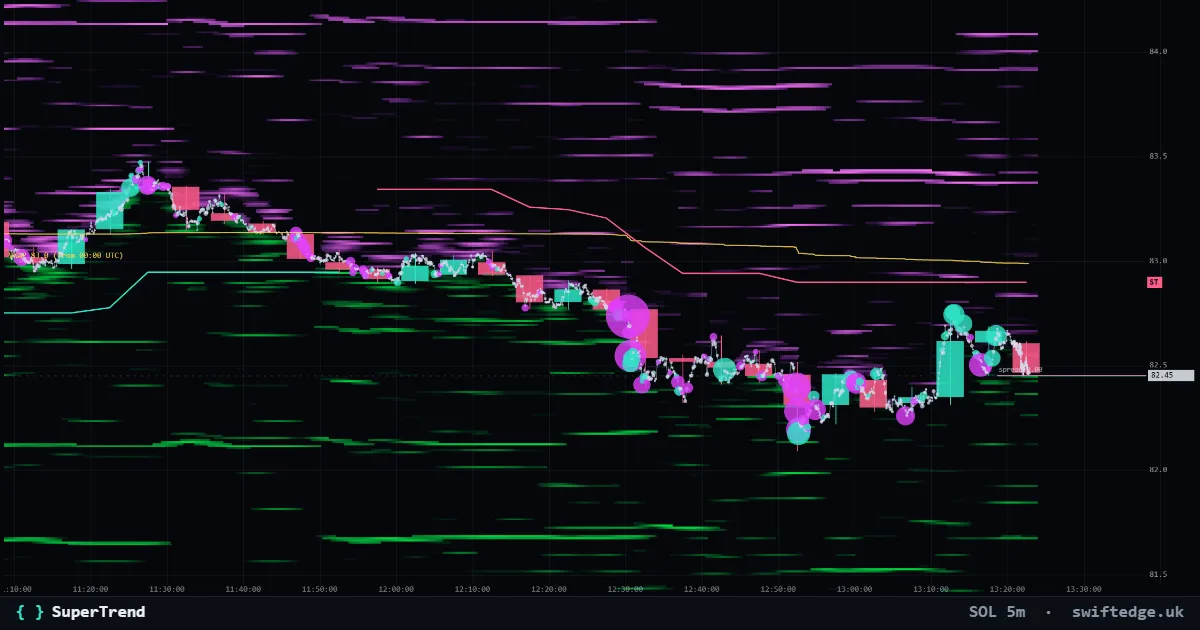
An ATR trailing line under price in uptrends and over price in downtrends; it flips when a candle closes through it.