Community scripts › Built into Depth › Squeeze Momentum
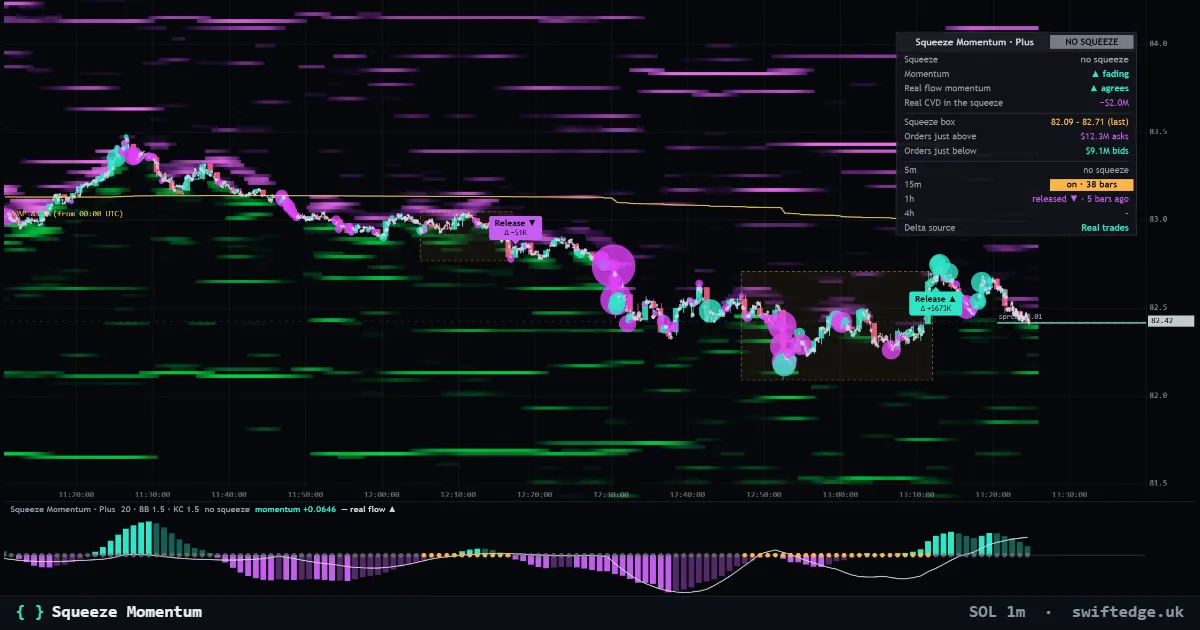
What it shows
The squeeze (Bollinger Bands inside the Keltner Channel) and its momentum histogram in a pane, with the same momentum on the real cumulative delta, the squeeze box on the price chart with the real orders and liquidations just outside it, and the squeeze on 5m, 15m, 1h and 4h.
How to read it
A squeeze is on when the Bollinger Bands sit inside the Keltner Channel, so volatility is compressed. The histogram in the pane shows momentum, with the same momentum computed on the real cumulative delta next to it. The box on the chart marks the squeeze with the real orders and liquidations just outside, and the table shows the squeeze on 5m, 15m, 1h and 4h.
What it can't tell you
A squeeze says volatility is low, not which way it will expand.
Settings in Depth
| Squeeze | |
|---|---|
| Bollinger length | 20 |
| Keltner length (also the momentum) | 20 |
| Bollinger width follows the Keltner width (as the popular script) | on |
| Otherwise Bollinger width (× stdev) | 2 |
| Keltner width (× range) | 1.5 |
| Keltner uses true range | on |
| Squeeze levels | classic (one level) |
| Pane | |
| Momentum histogram | on |
| Squeeze dots on the zero line | on |
| Momentum of the real cumulative delta (line) | on |
| Price chart | |
| Squeeze box on the price chart | on |
| Release marks (▲ / ▼) | on |
| Shortest squeeze shown as a box (bars) | 4 |
| Past squeezes shown (0 = all) | 6 |
| Real data | |
| Real orders and liquidations just outside the box | on |
| Real delta at each release | on |
| Squeeze on 5m, 15m, 1h and 4h in the dashboard | on |
FAQ
What is a squeeze?
Bollinger Bands inside the Keltner Channel: unusually low volatility.
What do the release marks mean?
The squeeze ended on that candle: the bands moved outside the channel.
Why momentum on CVD as well?
It shows whether aggressive flow pushes the same way as price during and after the squeeze.
More in Swiftedge Plus
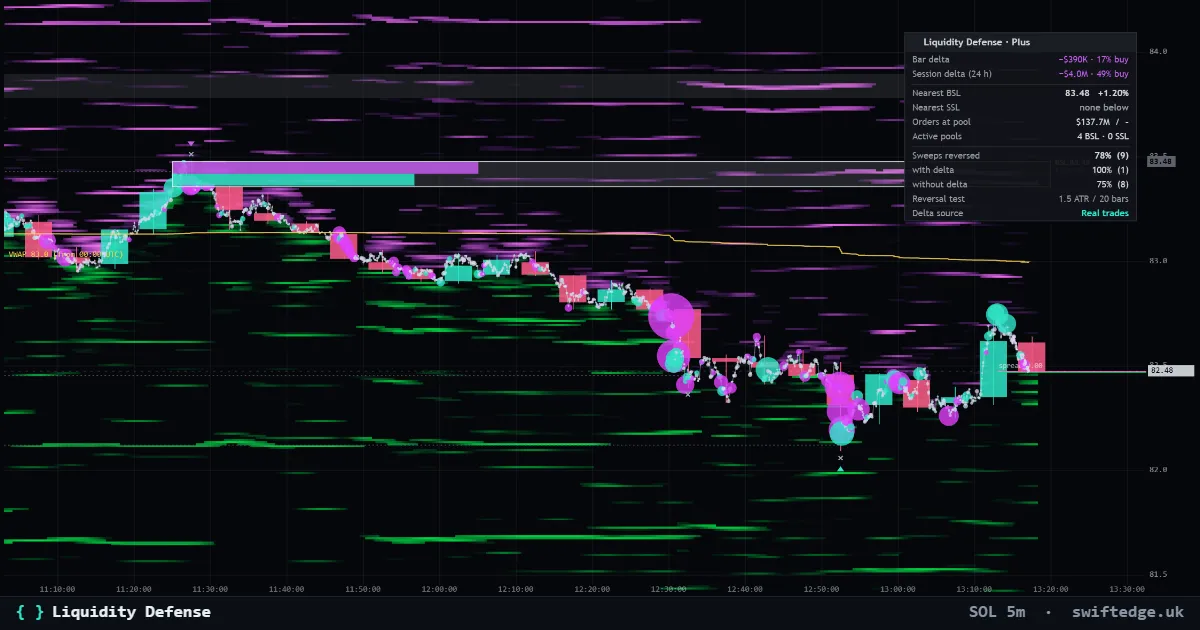
Buy-side and sell-side pools above highs and below lows with formation, defense profile and sweeps, from real trades, with the orders and liquidations at the nearest pools.
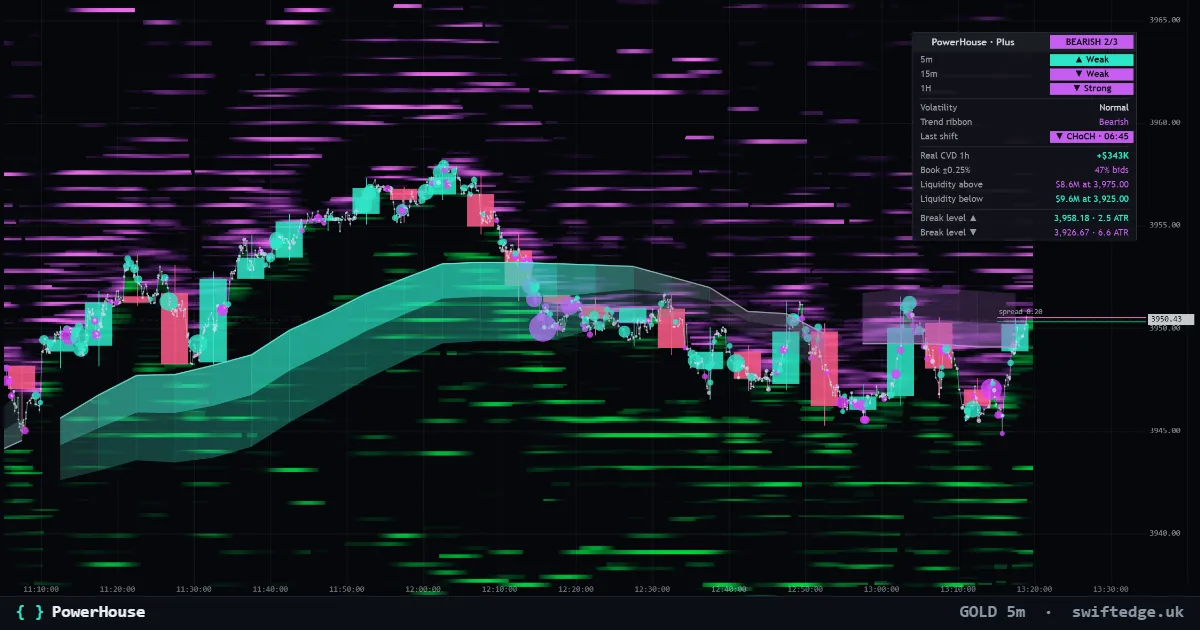
The adaptive trend ribbon, structure shifts (CHoCH and BOS) and a Trend Matrix, with the real walls and liquidation clusters above and below price.
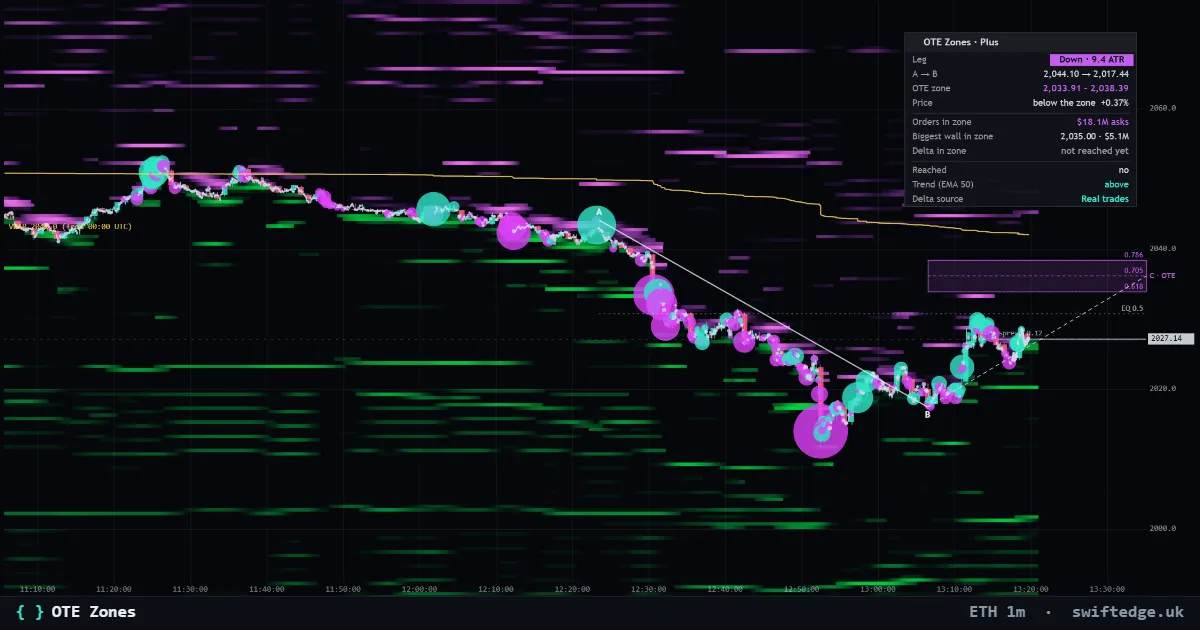
The latest impulse leg A to B and its optimal trade entry zone (0.618 to 0.786), with the real orders and liquidations inside the zone and who traded when price was in it.