Community scripts › Built into Depth › OTE Zones
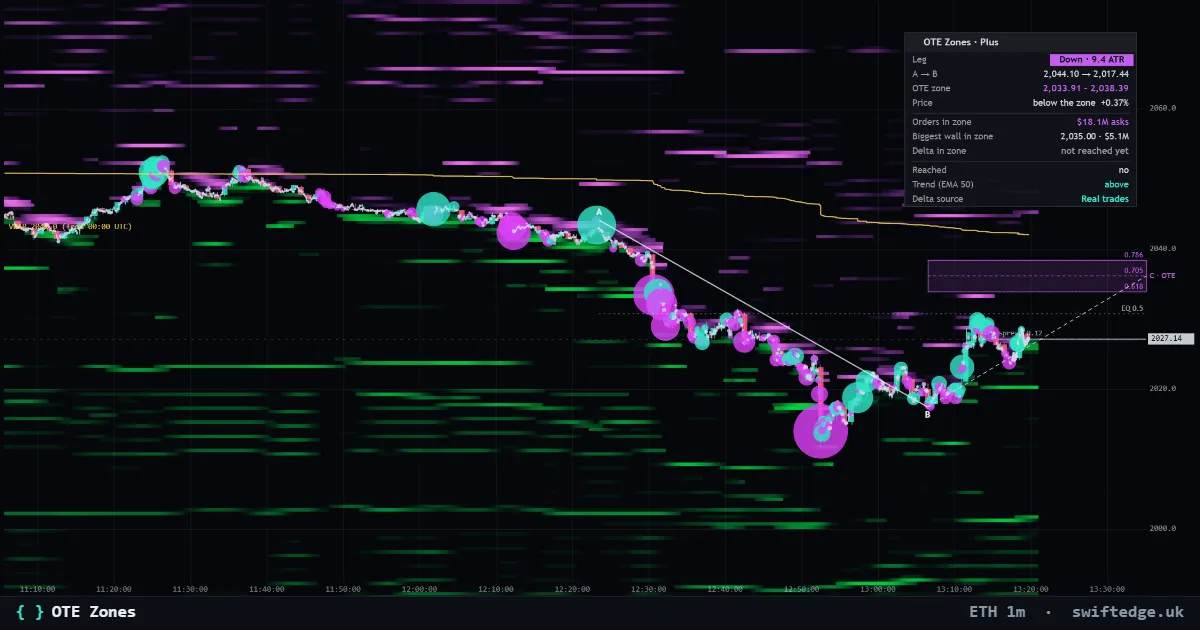
What it shows
The latest impulse leg A to B and its optimal trade entry zone (0.618 to 0.786), with the real orders and liquidations inside the zone and who traded when price was in it.
How to read it
The tool finds the latest impulse leg from A to B and draws the optimal trade entry zone between the 0.618 and 0.786 retracement. Inside the zone it shows the real orders and liquidations, and the panel shows who traded while price was in it.
What it can't tell you
The zone is a retracement of one leg. Price can stop before it or run through it.
Settings in Depth
| Structure | |
|---|---|
| Swing pivot length | 8 bars |
| Smallest leg (× ATR 14) | 1.0 |
| Zone | |
| Fib lines 0.618 · 0.705 · 0.786 | on |
| Equilibrium (0.5) | on |
| A-B-C lines and labels | on |
| Earlier zones (faded) | off |
| Mark when price reaches the zone | on |
| EMA 50 (trend context) | off |
| Real data | |
| Orders and liquidations inside the zone | on |
| Delta while price is in the zone | on |
FAQ
What is the OTE zone?
The area between the 0.618 and 0.786 retracement of the latest impulse leg.
How is the leg chosen?
It is the latest impulse leg from A to B by the indicator's swing rules.
What does 'who traded' mean?
Aggressive buying and selling while price was inside the zone.
More in Swiftedge Plus
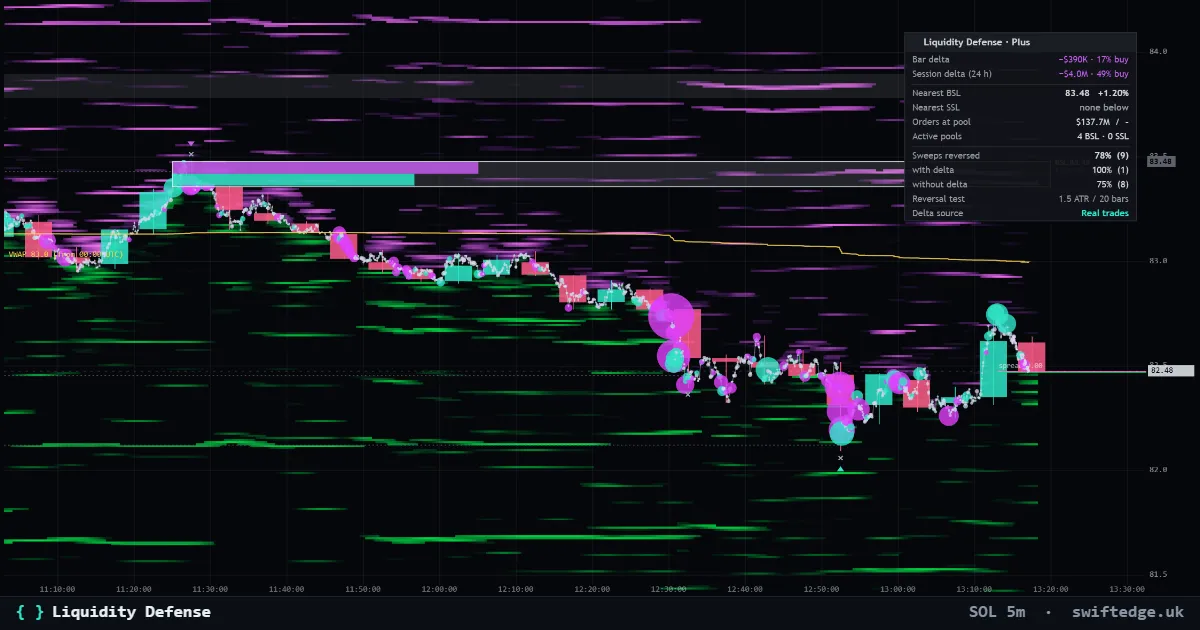
Buy-side and sell-side pools above highs and below lows with formation, defense profile and sweeps, from real trades, with the orders and liquidations at the nearest pools.
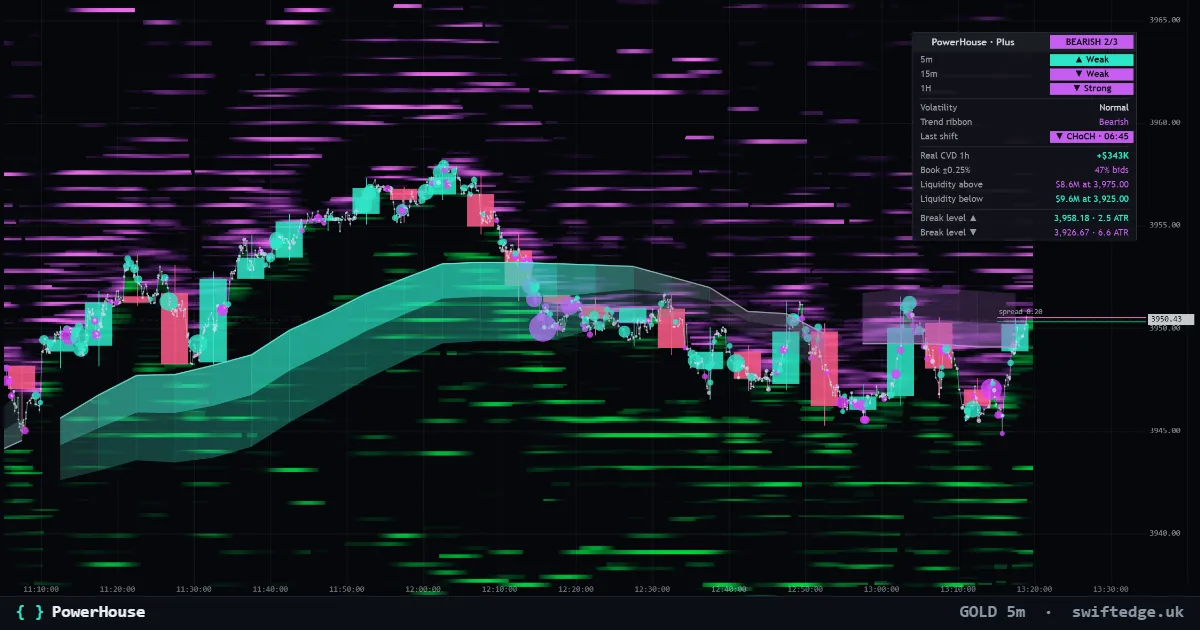
The adaptive trend ribbon, structure shifts (CHoCH and BOS) and a Trend Matrix, with the real walls and liquidation clusters above and below price.
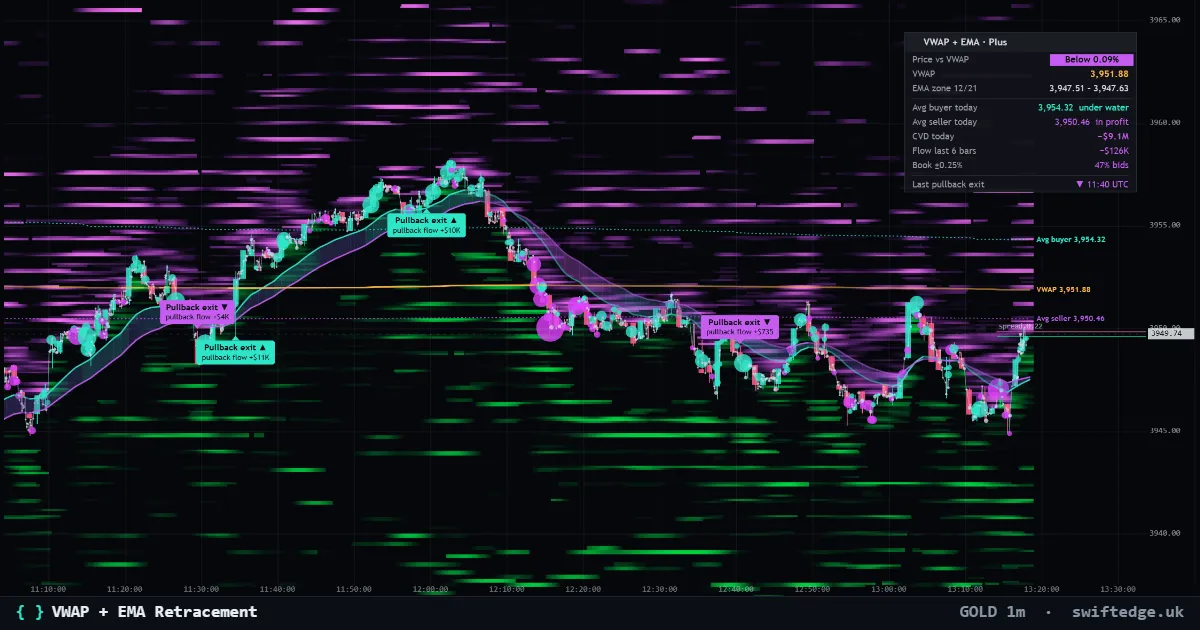
VWAP and the EMA 12/21 zone with pullback exits, the zone colored by real flow and where today's average buyer and seller got in.