Community scripts › Built into Depth › Fair value gaps
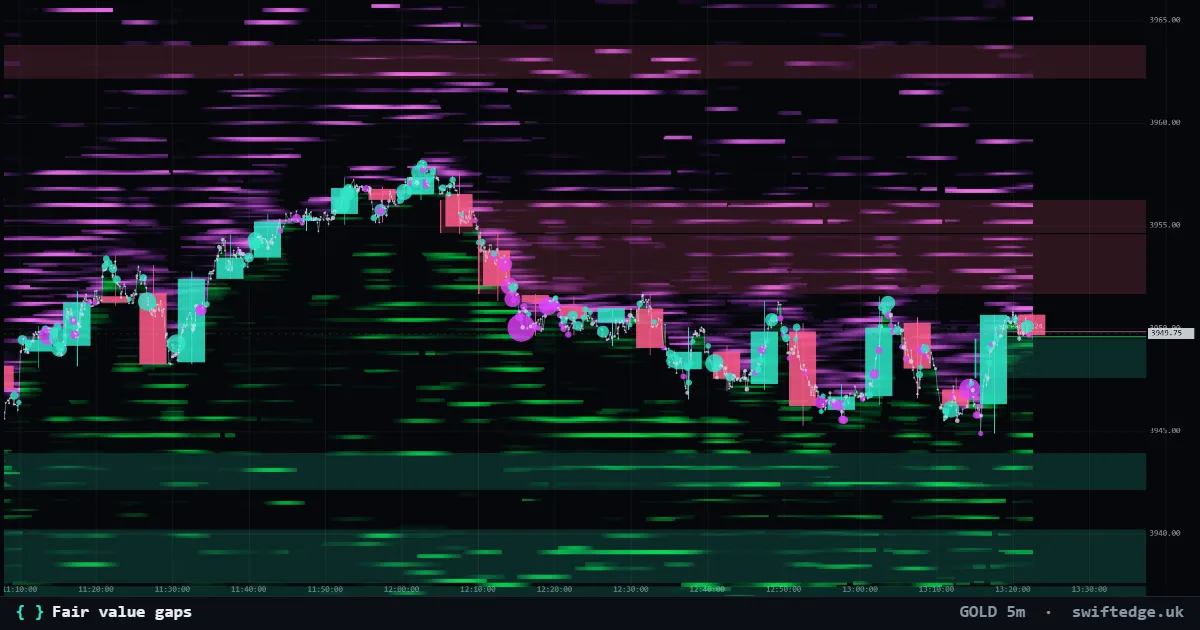
What it shows
Three-candle gaps where price moved too fast to trade both ways; shown until price fills them.
How to read it
A bullish gap is the space between the first candle's high and the third candle's low when they do not overlap.
How it's calculated
A bullish fair value gap appears when a candle's low is above the high of the candle two places earlier; a bearish one when a candle's high is below that candle's low. The gap is the price range in between, which the middle candle crossed without trading both ways. Depth keeps a gap on the chart until price trades back to its far edge, and by default ignores gaps smaller than 0.03 % of price.
What it can't tell you
A gap marks a fast move. It is not an order, and there is no rule that price has to come back to it.
Fair value gaps on 9 markets right now
| Market | Price | Nearest open gaps | Reading | |
|---|---|---|---|---|
| Bitcoin | 72,070 | Above 72,546–72,695 | 9 open gaps; the nearest is 0.66 % away | Open chart › |
| Gold | 3,899.33 | Above 3,912.84–3,933.88 | 7 open gaps; the nearest is 0.35 % away | Open chart › |
| Ethereum | 2,012 | Above 2,017–2,017 | 10 open gaps; the nearest is 0.23 % away | Open chart › |
| Solana | 81.47 | Above 81.61–82.05 | 13 open gaps; the nearest is 0.18 % away | Open chart › |
| XRP | 1.0303 | Above 1.0399–1.0496 | 10 open gaps; the nearest is 0.93 % away | Open chart › |
| US 500 | 7,590.40 | Above 7,603.30–7,614.20 · Below 7,454.00–7,496.40 | Price inside an open bearish gap; 5 open gaps on the 1h chart | Open chart › |
| US 100 | 28,241.2 | Above 28,400.3–28,424.0 · Below 27,814.1–27,826.5 | Price inside an open bearish gap; 9 open gaps on the 1h chart | Open chart › |
| Silver | 50.451 | Above 50.564–50.849 · Below 49.399–49.728 | Price inside an open bullish gap; 5 open gaps on the 1h chart | Open chart › |
| WTI crude oil | 85.39 | Above 86.39–86.75 · Below 85.00–85.13 | 14 open gaps; the nearest is 0.30 % away | Open chart › |
Settings in Depth
| Timeframe | the chart's timeframe (or a fixed 1m to 1D) |
| Minimum gap (% of price) | 0.03 |
| Keep filled gaps (faded) | off |
FAQ
When is a gap filled?
A bullish gap is filled when price trades down to its lower edge; a bearish gap when price trades up to its upper edge.
What does 'open gaps' in the table count?
Gaps on the 1h chart in the loaded history (about 15 days) that price has not filled yet.
How is this different from FVG Lifecycle?
FVG Lifecycle in Swiftedge Plus follows each gap as it shrinks, inverts and fills, with the real delta that made it.
More in Classic indicators
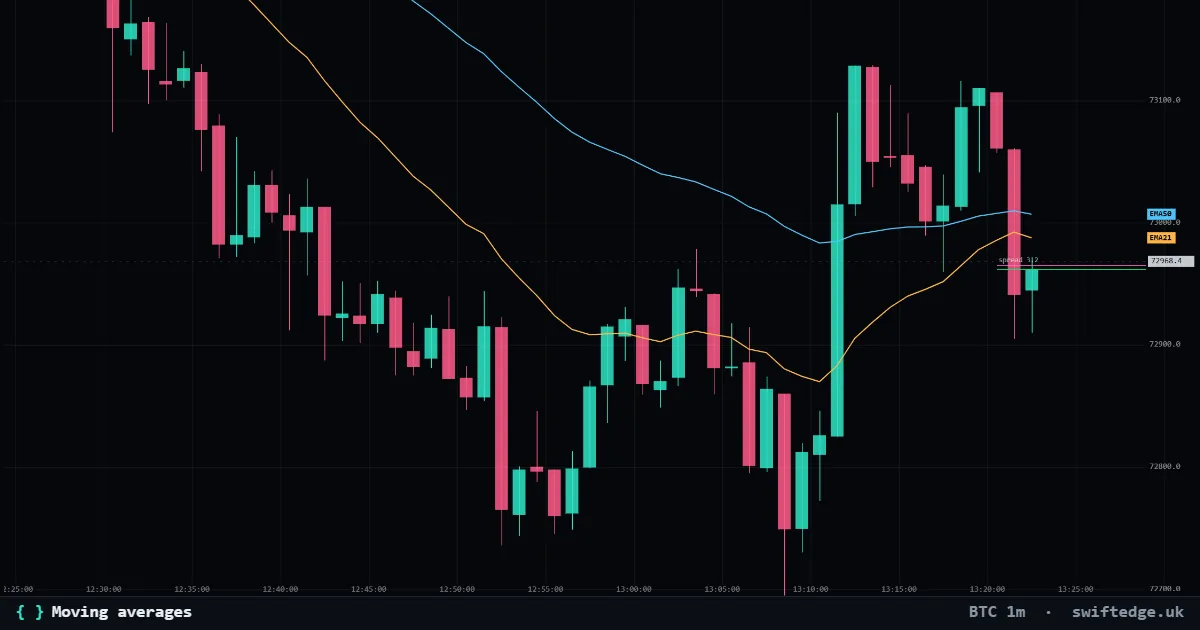
Up to three simple, exponential or weighted moving averages of the close.
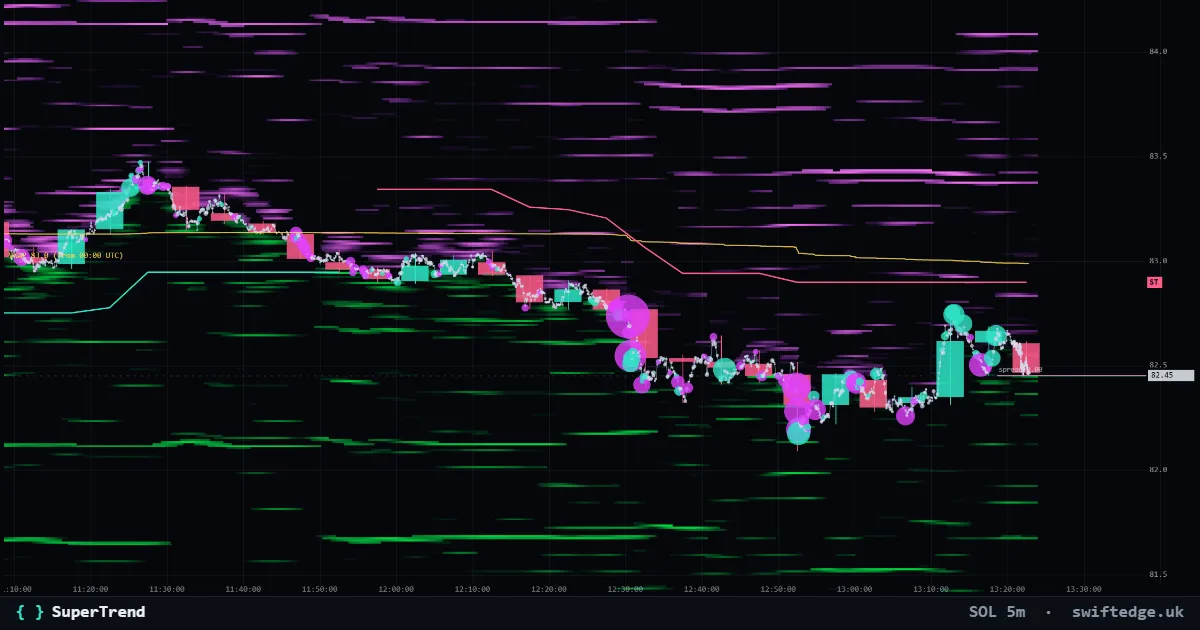
An ATR trailing line under price in uptrends and over price in downtrends; it flips when a candle closes through it.
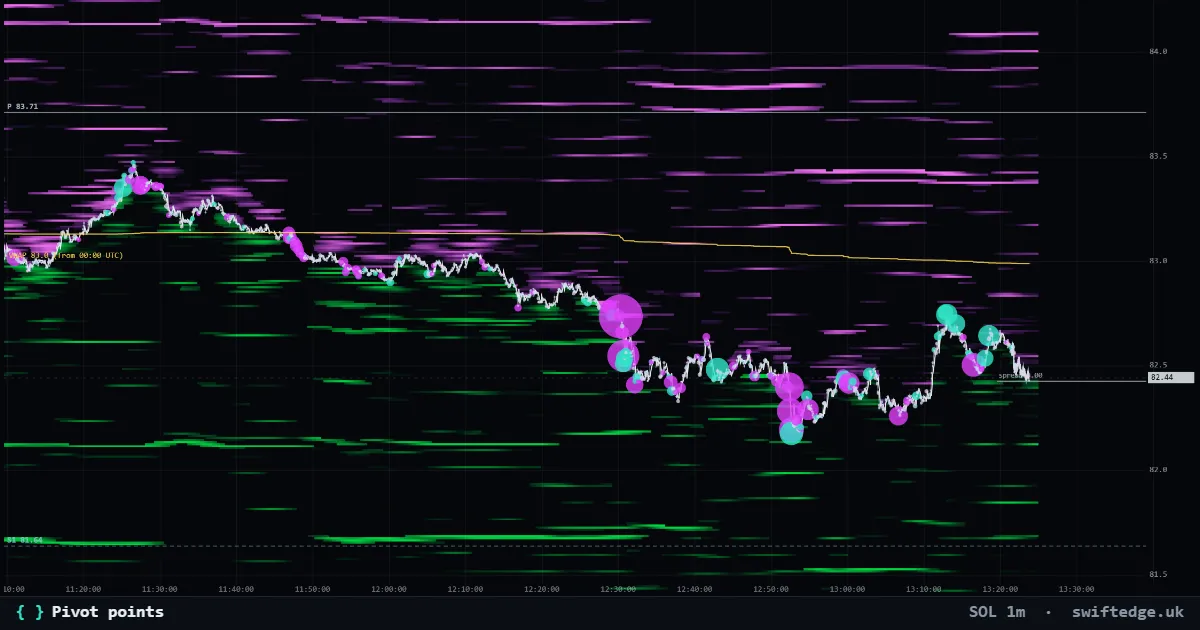
Classic, Fibonacci or Camarilla pivots from the previous day's or week's high, low and close.