Community scripts › Delta Bars
What it does
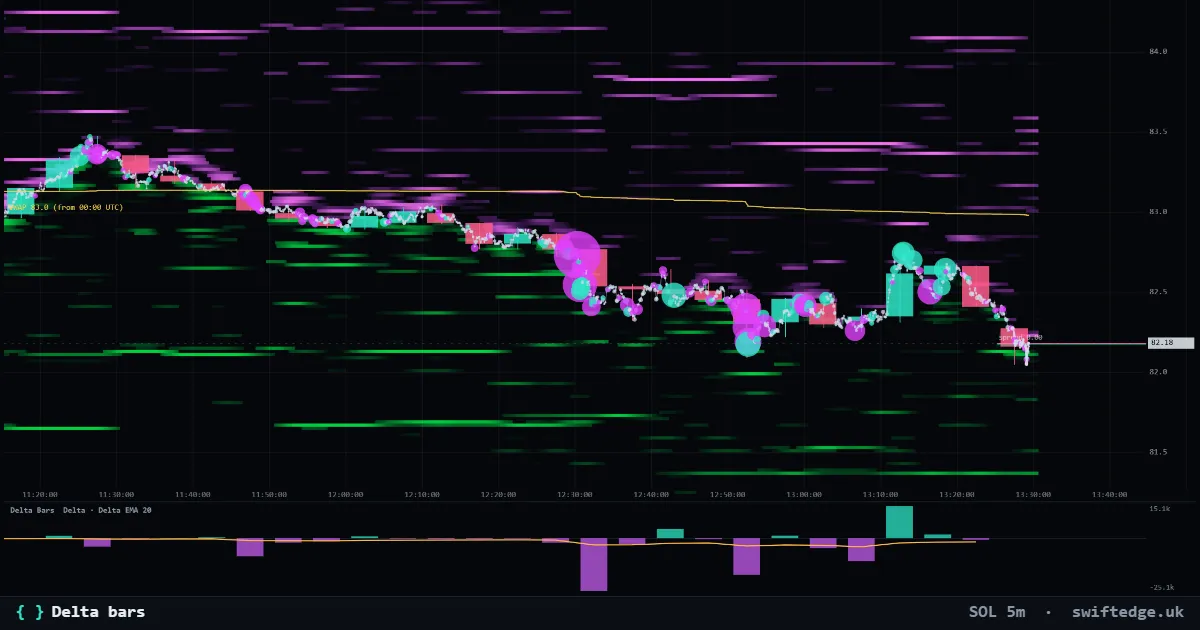
A histogram under the chart with the real delta of every bar, the taker buy volume minus the taker sell volume, plus an average of it.
How it works
Each bar's delta comes from the trades in that bar. Bars above zero had more aggressive buying, bars below zero more aggressive selling. The line is an EMA of the delta.
How to use it
Look for price moves that the delta does not confirm, or for unusually large delta bars that price did not follow. Change the average length in the settings.
What's original
Uses real buy and sell volume per bar, which a price-only chart cannot calculate.
Limitations
Delta says who was aggressive, not who was right. On low timeframes single large trades can dominate a bar.
Source code
Open source under MPL-2.0. Copy it with credit: "Copy to my scripts" adds the credit for you.
script({ name: "Delta bars" });

const len = input.int(20, "Average length", { min: 2, max: 200 });

// Real buy volume minus sell volume for every bar, under the chart
plot.histogram("Delta", delta);
plot.line("Delta EMA " + len, ta.ema(delta, len), { pane: "lower", tone: "warn" });