Community scripts › Absorption Bars
Absorption Bars
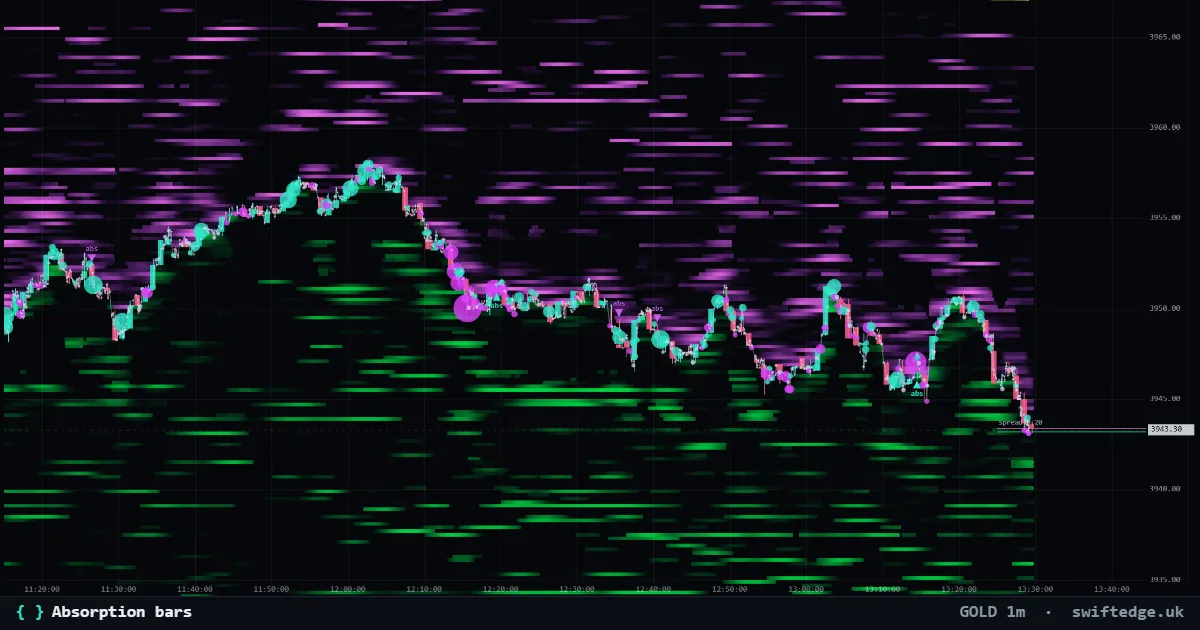
What it does
Marks bars where heavy market selling did not push price down, or heavy buying did not push it up: a sign that resting orders absorbed the aggressive side.
How it works
It compares each bar's real delta with the average absolute delta of the last 50 bars. A bar with strongly negative delta that still closed up is marked as absorbed selling, and the opposite for buying.
How to use it
Read the markers together with the heatmap and the levels around them. Change the delta multiple in the settings to see fewer or more bars.
What's original
Absorption is usually judged by eye on a footprint. This turns it into a simple, adjustable rule on real delta that you can copy and refine.
Limitations
A single bar is a weak sample. Absorption can fail on the next bar, and the rule ignores where in the bar the volume traded.
Source code
Open source under MPL-2.0. Copy it with credit: "Copy to my scripts" adds the credit for you.
script({ name: "Absorption bars" });

const k = input.number(2, "Delta vs average (x)", { min: 1, max: 6, step: 0.5 });
const avg = ta.sma(delta.map(Math.abs), 50);

onBar((bar, i) => {
  if (!(avg[i] > 0)) return;
  // Heavy selling, yet the bar closed up: the sells were absorbed
  if (bar.delta < -k * avg[i] && bar.close > bar.open) plot.marker(i, bar.low, { shape: "up", tone: "bid", label: "abs" });
  // Heavy buying, yet the bar closed down
  if (bar.delta > k * avg[i] && bar.close < bar.open) plot.marker(i, bar.high, { shape: "down", tone: "ask", label: "abs" });
});