Community scripts › Built into Depth › Liquidity
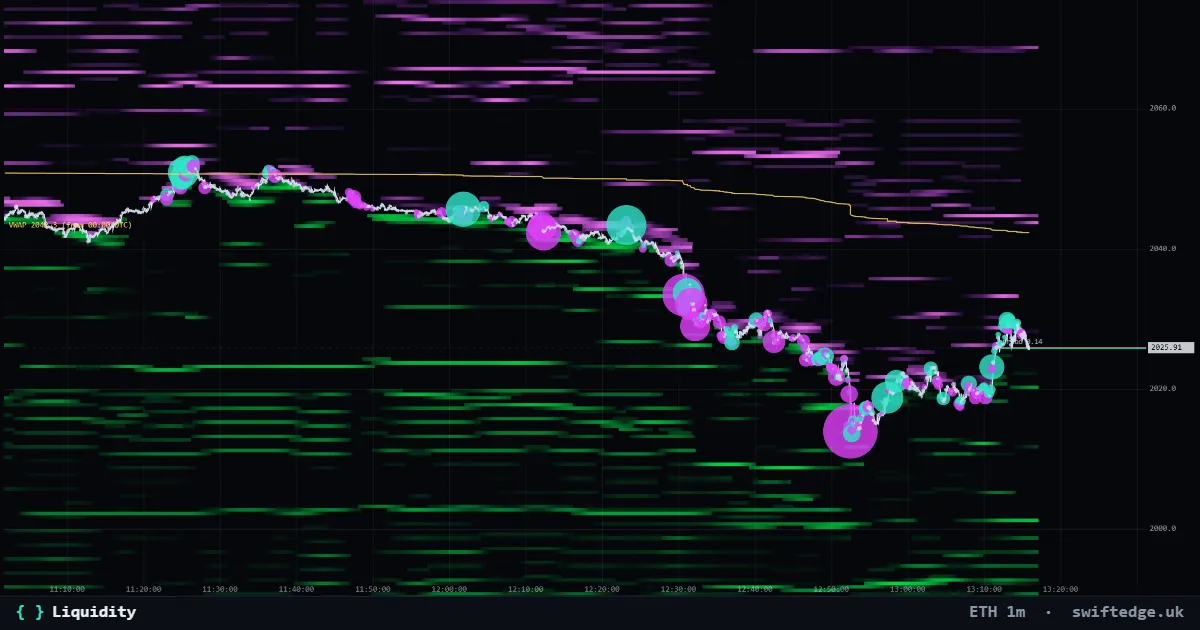
The core of Swiftedge: every resting order in the book, live. Walls, and orders pulled before price gets there, show up as they happen.
What it shows
Resting limit orders in the order book by price and time: green bids below price, violet asks above. Brighter means more size.
How to read it
The heatmap is the order book over time. Each column is a snapshot (four a second); each row a price. Bright bands that stay in place are large resting orders, often called walls. Watch whether price stops at them, eats through them or whether they disappear before price arrives (pulled).
How it's calculated
Depth records the full order book about four times a second and draws each snapshot as a column: one row per price, brighter for more resting size. Bids below price are green and asks above are violet. Because the columns line up over time, orders that stay in place become bands, and orders that are pulled disappear from one column to the next.
What it can't tell you
Resting orders can be canceled at any moment, so a wall is a fact about now, not a promise. The heatmap shows what was visible in the book; it cannot show hidden orders.
Liquidity on 9 markets right now
| Market | Price | Resting within 1 % | Reading | |
|---|---|---|---|---|
| Bitcoin | 71,875 | Bids $168.9M · Asks $153.4M | Biggest wall within 1 %: ask at 72,400 ($27.0M), 0.73 % away; more bids than asks resting overall | Open chart › |
| Gold | 3,904.98 | Bids $19.6M · Asks $17.5M | Biggest wall within 1 %: bid at 3,884.00 ($2.8M), 0.54 % away; more bids than asks resting overall | Open chart › |
| Ethereum | 1,992 | Bids $76.2M · Asks $76.1M | Biggest wall within 1 %: bid at 1,978 ($11.9M), 0.69 % away; bids and asks about even resting overall | Open chart › |
| Solana | 80.86 | Bids $31.8M · Asks $30.3M | Biggest wall within 1 %: ask at 81.20 ($5.4M), 0.42 % away; more bids than asks resting overall | Open chart › |
| XRP | 1.0258 | Bids $22.3M · Asks $22.9M | Biggest wall within 1 %: bid at 1.0200 ($5.0M), 0.57 % away; bids and asks about even resting overall | Open chart › |
| US 500 | 7,561.93 | Bids $18.5M · Asks $20.3M | Biggest wall within 1 %: ask at 7,575.00 ($3.8M), 0.17 % away; more asks than bids resting overall | Open chart › |
| US 100 | 27,972.0 | Bids $20.5M · Asks $20.0M | Biggest wall within 1 %: ask at 28,020.0 ($3.8M), 0.17 % away; bids and asks about even resting overall | Open chart › |
| Silver | 50.388 | Bids $14.1M · Asks $15.7M | Biggest wall within 1 %: bid at 50.280 ($2.3M), 0.21 % away; more asks than bids resting overall | Open chart › |
| WTI crude oil | 85.30 | Bids $10.3M · Asks $13.0M | Biggest wall within 1 %: ask at 85.70 ($1.4M), 0.47 % away; more asks than bids resting overall | Open chart › |
FAQ
What is a wall?
A price where much more size rests than around it. In the table it is the largest bid or ask within 1 % of price.
Why do walls sometimes disappear before price gets there?
The order was canceled (pulled). The heatmap keeps the history, so you can see that it was there and when it left.
Does it work on gold, silver, crude oil and US 100?
Yes. Depth records the order book for all nine markets in the same way.
More in Order flow
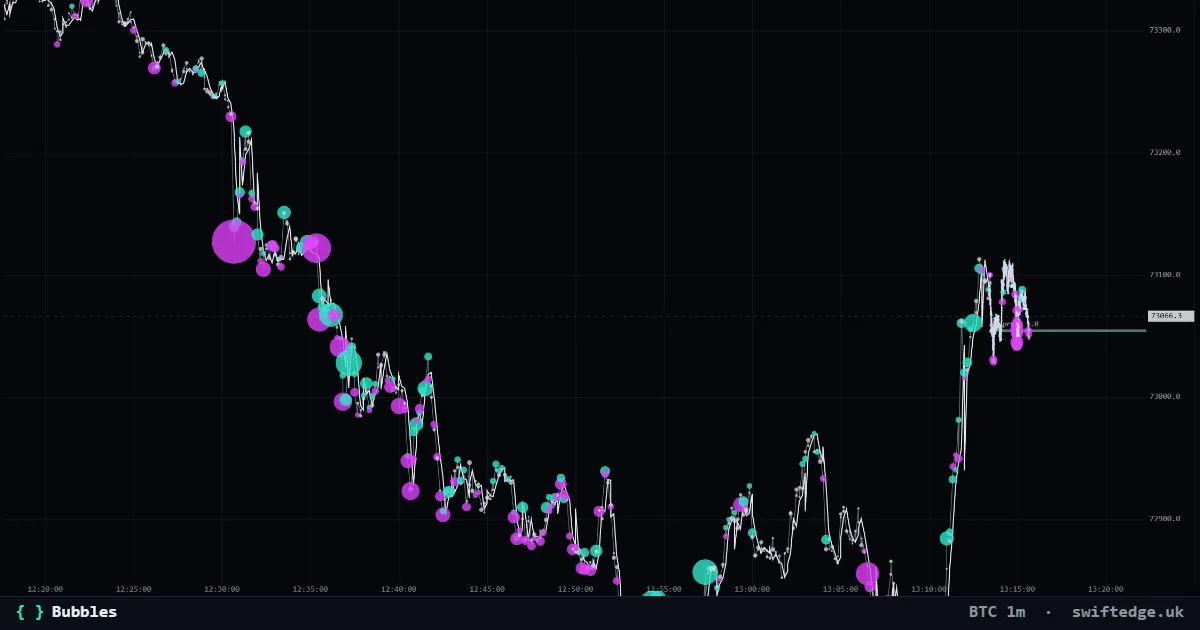
Every trade as a bubble: teal for aggressive buys, violet for aggressive sells; the size is the volume.
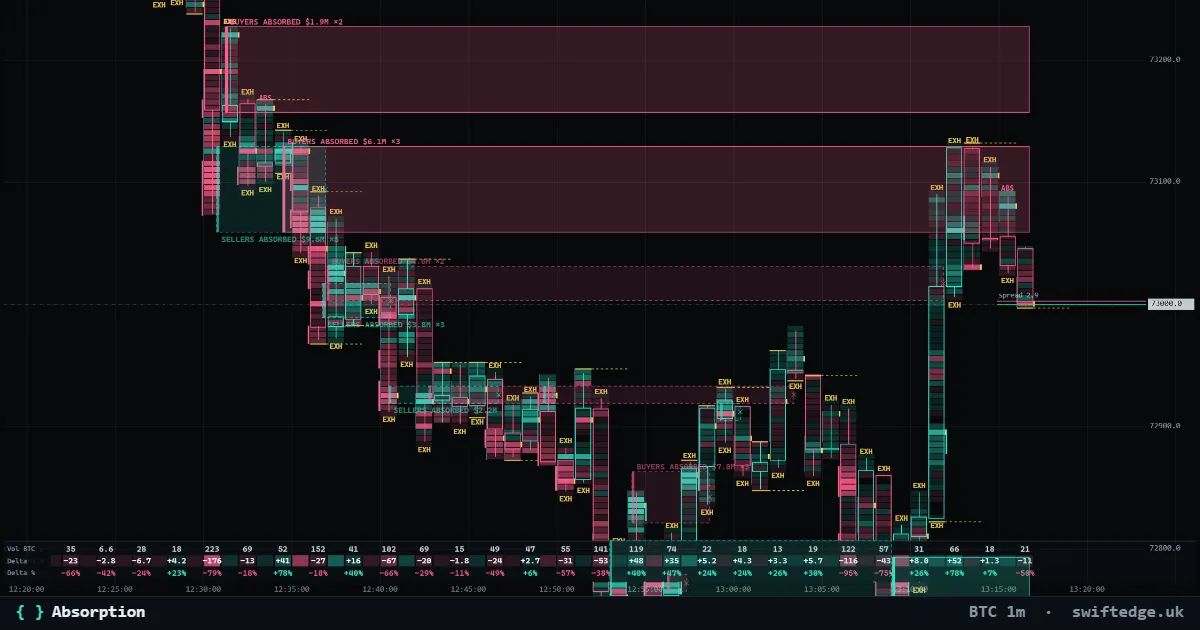
Zones where heavy aggressive selling (or buying) hit a price level and price did not get through; the zone runs until price trades past it.
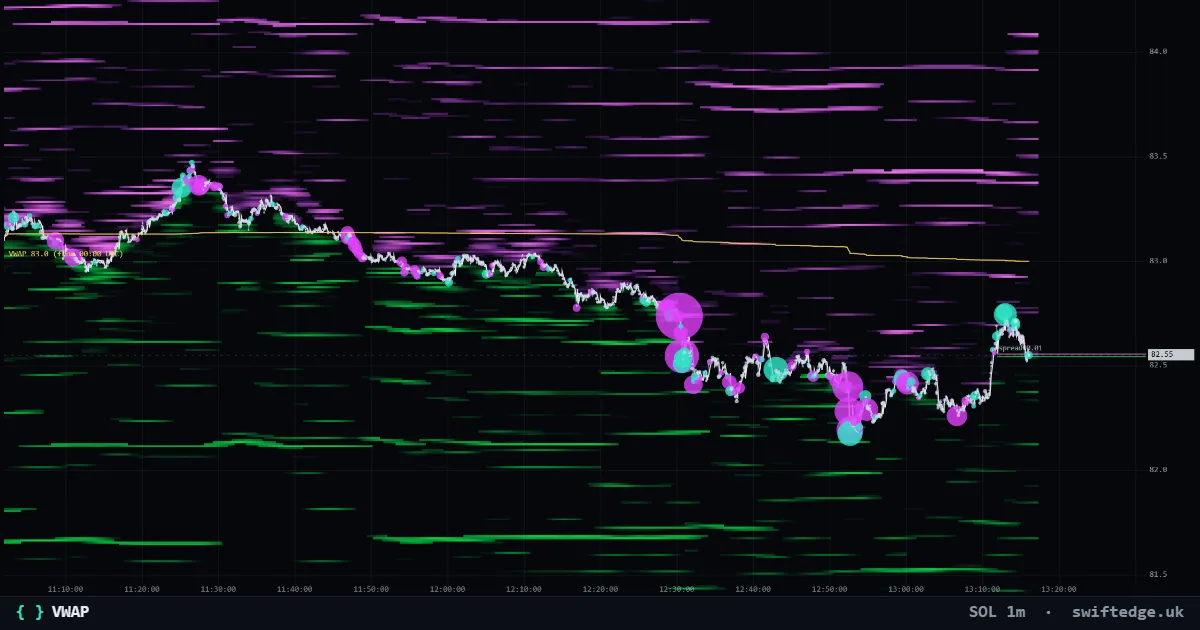
The volume-weighted average price since 7:00 PM ET (00:00 UTC): the average price paid per coin today.