Community scripts › Built into Depth › ADX / DMI
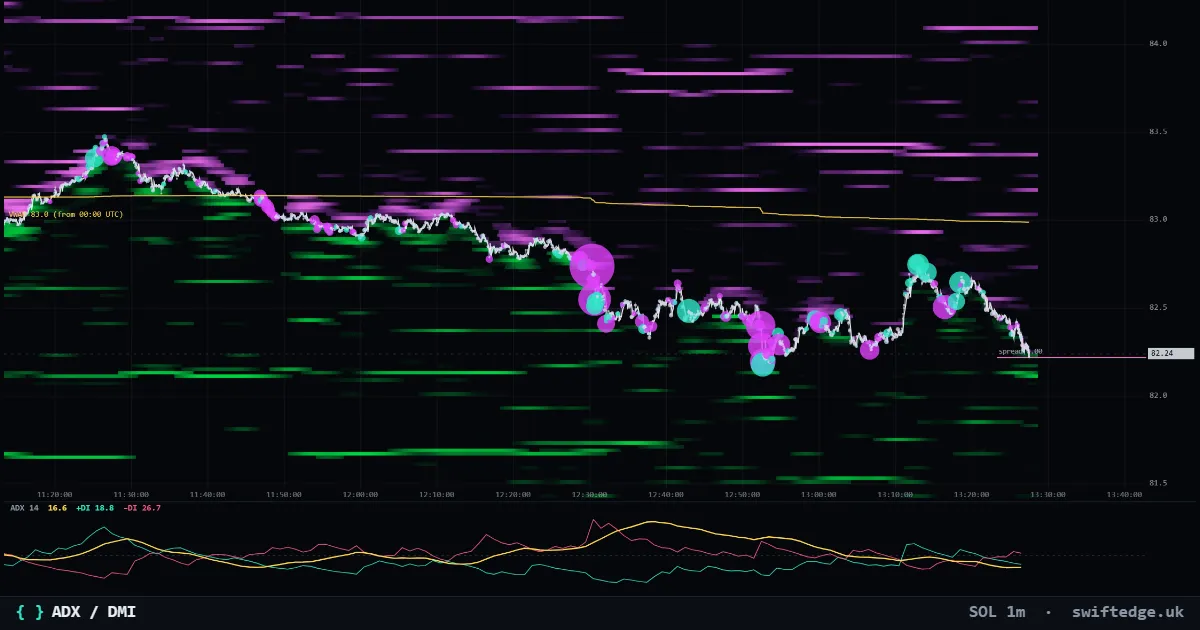
What it shows
Trend strength (ADX) with the plus and minus directional lines in a pane.
How to read it
ADX above about 25 is usually read as a trending market; +DI above −DI points up, the opposite down.
How it's calculated
The directional lines compare each candle's high and low with the previous one: +DI from up moves and -DI from down moves, each smoothed over 14 candles and divided by the ATR. DX is the difference between the two divided by their sum, and ADX is DX smoothed over another 14 candles.
What it can't tell you
ADX shows how strong a trend is, not its direction; +DI and -DI show the direction. It reacts slowly because it is smoothed twice.
ADX / DMI on 9 markets right now
| Market | Price | ADX · DI | Reading | |
|---|---|---|---|---|
| Bitcoin | 72,070 | 30.3 · +DI 7.5 · −DI 36.6 | Trending (ADX above 25); +DI below −DI | Open chart › |
| Gold | 3,899.33 | 56.6 · +DI 5.6 · −DI 40.7 | Trending (ADX above 25); +DI below −DI | Open chart › |
| Ethereum | 2,012 | 33.4 · +DI 7.8 · −DI 38.8 | Trending (ADX above 25); +DI below −DI | Open chart › |
| Solana | 81.47 | 35.2 · +DI 8.7 · −DI 34.3 | Trending (ADX above 25); +DI below −DI | Open chart › |
| XRP | 1.0303 | 25.0 · +DI 12.5 · −DI 31.4 | Trending (ADX above 25); +DI below −DI | Open chart › |
| US 500 | 7,590.40 | 14.9 · +DI 19.4 · −DI 23.7 | Weak trend (ADX below 20); +DI below −DI | Open chart › |
| US 100 | 28,241.2 | 18.3 · +DI 23.2 · −DI 23.7 | Weak trend (ADX below 20); +DI below −DI | Open chart › |
| Silver | 50.451 | 43.2 · +DI 5.6 · −DI 32.5 | Trending (ADX above 25); +DI below −DI | Open chart › |
| WTI crude oil | 85.39 | 17.7 · +DI 32.9 · −DI 20.0 | Weak trend (ADX below 20); +DI above −DI | Open chart › |
Settings in Depth
| Timeframe | the chart's timeframe (or a fixed 1m to 1D) |
| DI length | 14 |
| ADX smoothing | 14 |
FAQ
What ADX value counts as a trend?
A common convention is above 25 for a trend and below 20 for a weak one. The table uses those bands as labels only.
What do +DI and -DI show?
+DI is the strength of up moves and -DI of down moves, both relative to the average true range.
Why is ADX slow?
DX is smoothed twice over 14 candles, so ADX needs time to rise or fall.
More in Classic indicators
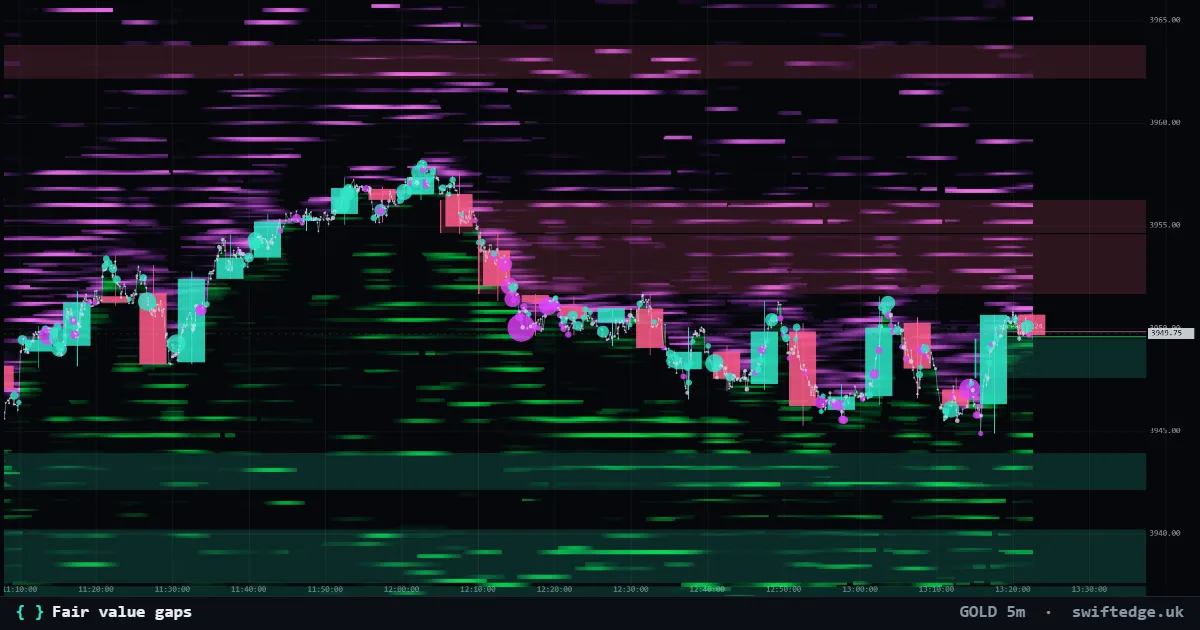
Three-candle gaps where price moved too fast to trade both ways; shown until price fills them.
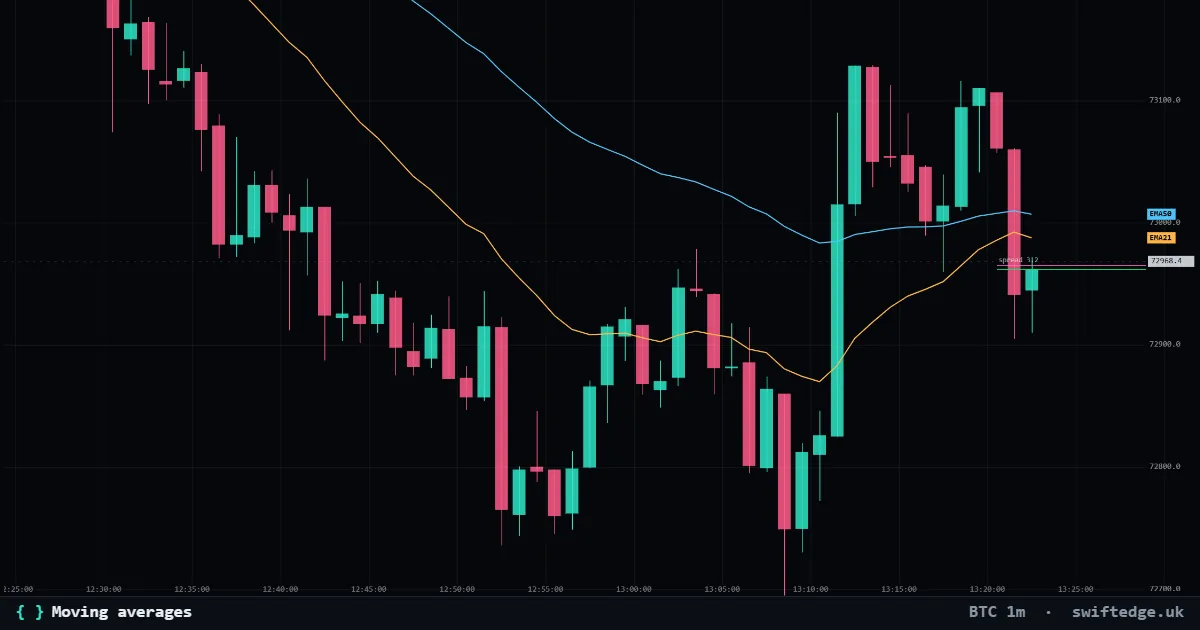
Up to three simple, exponential or weighted moving averages of the close.
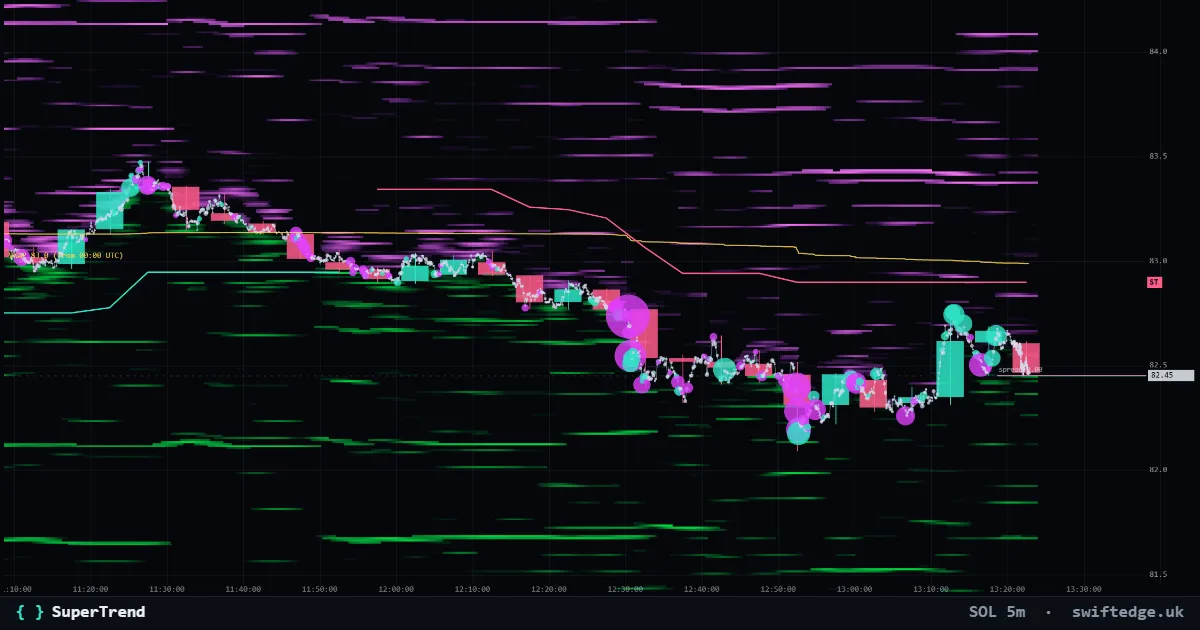
An ATR trailing line under price in uptrends and over price in downtrends; it flips when a candle closes through it.