Community scripts › Big Liquidations
Big Liquidations
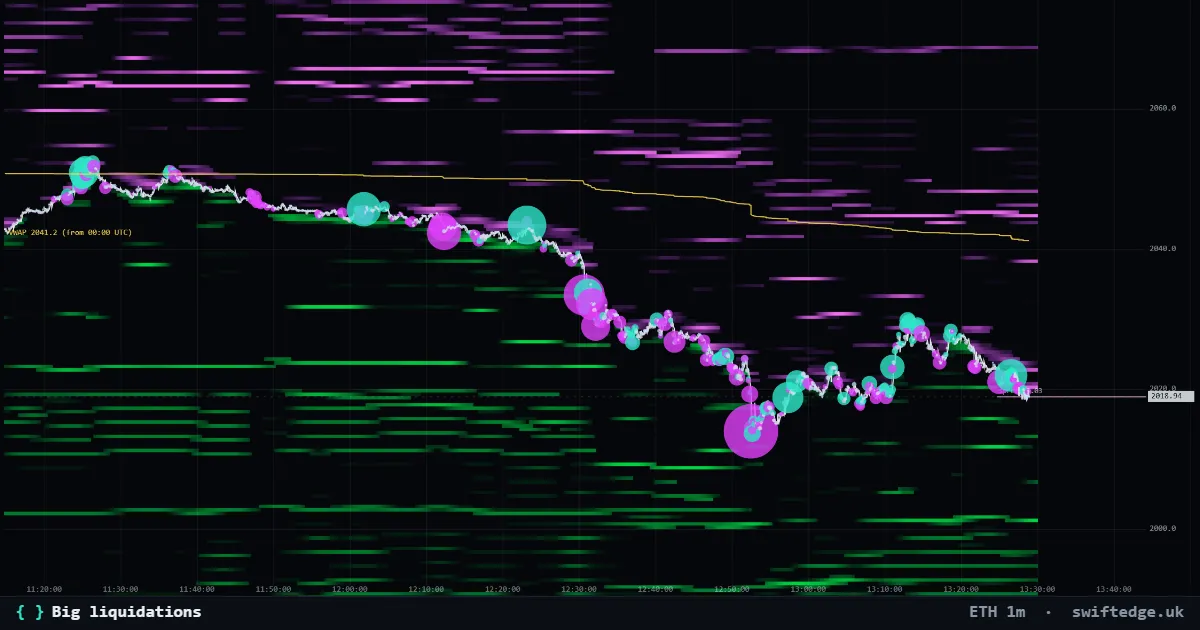
What it does
Puts a dot on the chart at the time and price of every large liquidation, colored by whether longs or shorts were closed by force.
How it works
It reads the recent liquidations for the market and keeps those above the minimum value you set. Longs closed by force are forced selling; shorts closed by force are forced buying.
How to use it
Look for clusters of forced selling or buying near the extremes of a move. Raise the minimum value to see only the largest events.
What's original
Shows the real liquidation events on the order book chart, so you can see them next to the walls and the trades that followed.
Limitations
Only the liquidations that are reported publicly are included, and the history is short. Liquidations explain a move after it happened; they do not say what comes next.
Source code
Open source under MPL-2.0. Copy it with credit: "Copy to my scripts" adds the credit for you.
script({ name: "Big liquidations" });

const min = input.number(100000, "Min value (USD)", { min: 1000, step: 10000 });

for (const l of liquidations) {
  if (l.value < min) continue;
  // side "long" = longs were closed by force (forced selling)
  plot.marker(l.time, l.price, { shape: "dot", tone: l.side === "long" ? "ask" : "bid", label: fmt(l.value) });
}