Community scripts › Built into Depth › Relative volume
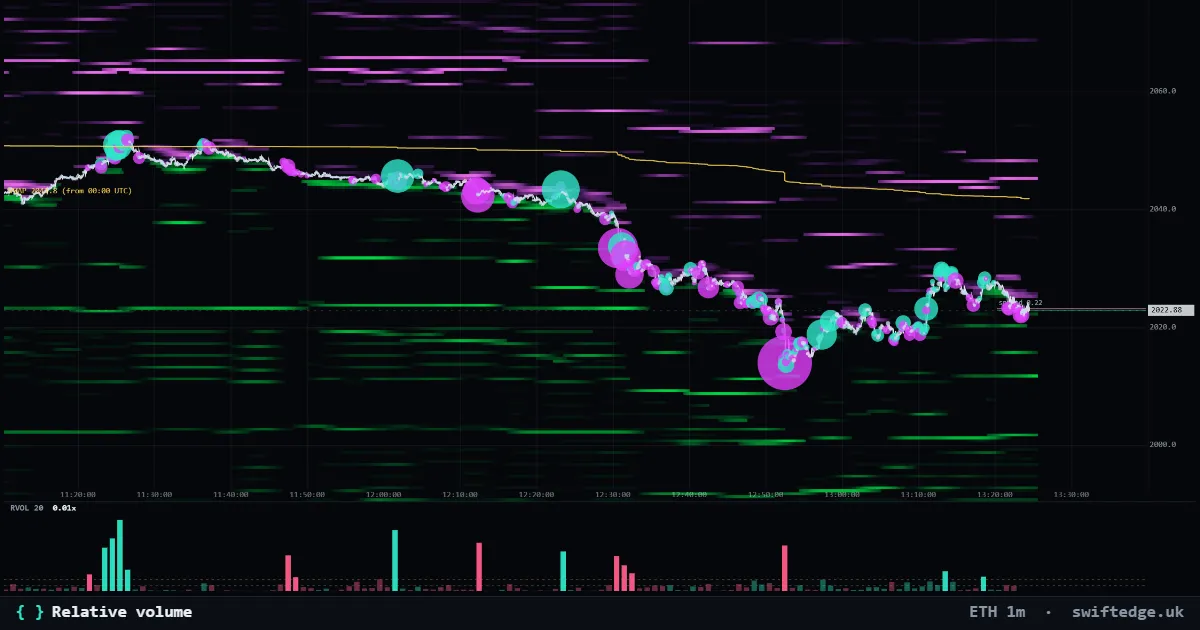
What it shows
Each candle's volume against its average, colored by whether buyers or sellers were the majority.
How to read it
2x means twice the average volume; spikes often come with breakouts, liquidations or news.
How it's calculated
Relative volume divides each candle's volume by the average volume of the last 20 candles. Bars are teal when aggressive buyers made up at least half of the volume and pink when sellers did; bars at 2x the average or more are drawn brighter.
What it can't tell you
Volume depends on the time of day: a 1h candle at the London or New York open is normally busier than one at night.
Relative volume on 9 markets right now
| Market | Price | Relative volume | Reading | |
|---|---|---|---|---|
| Bitcoin | 72,070 | 3.73x | Last closed candle: above the 20-candle average; sellers were the majority | Open chart › |
| Gold | 3,899.33 | 4.04x | Last closed candle: above the 20-candle average; sellers were the majority | Open chart › |
| Ethereum | 2,012 | 5.54x | Last closed candle: above the 20-candle average; sellers were the majority | Open chart › |
| Solana | 81.47 | 4.61x | Last closed candle: above the 20-candle average; sellers were the majority | Open chart › |
| XRP | 1.0303 | 3.39x | Last closed candle: above the 20-candle average; sellers were the majority | Open chart › |
| US 500 | 7,590.40 | 2.29x | Last closed candle: above the 20-candle average; buyers were the majority | Open chart › |
| US 100 | 28,241.2 | 2.59x | Last closed candle: above the 20-candle average; sellers were the majority | Open chart › |
| Silver | 50.451 | 3.61x | Last closed candle: above the 20-candle average; sellers were the majority | Open chart › |
| WTI crude oil | 85.39 | 5.43x | Last closed candle: above the 20-candle average; sellers were the majority | Open chart › |
Settings in Depth
| Timeframe | the chart's timeframe (or a fixed 1m to 1D) |
| Average length | 20 |
FAQ
Why does the table use the last closed candle?
The current candle has only part of its hour's volume, so its relative volume would look low until it closes.
What counts as high relative volume?
Depth highlights 2x the average by default; the threshold is a setting.
How do you know whether buyers or sellers were the majority?
Each candle carries the volume of aggressive buys. When that is at least half of the total, buyers were the majority.
More in Classic indicators
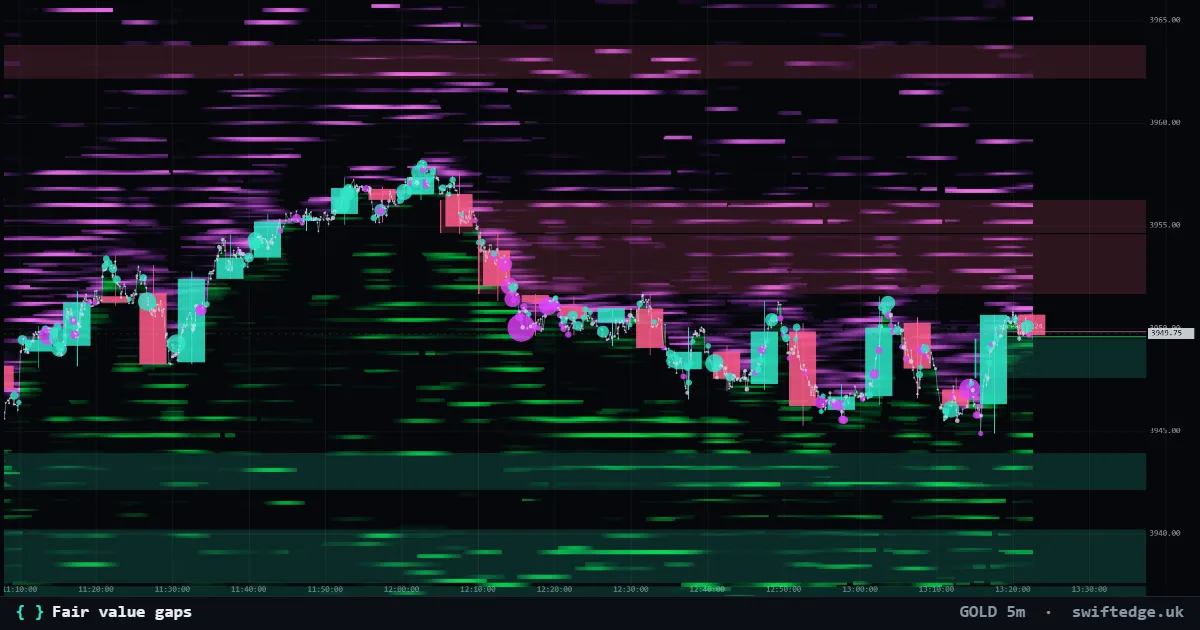
Three-candle gaps where price moved too fast to trade both ways; shown until price fills them.
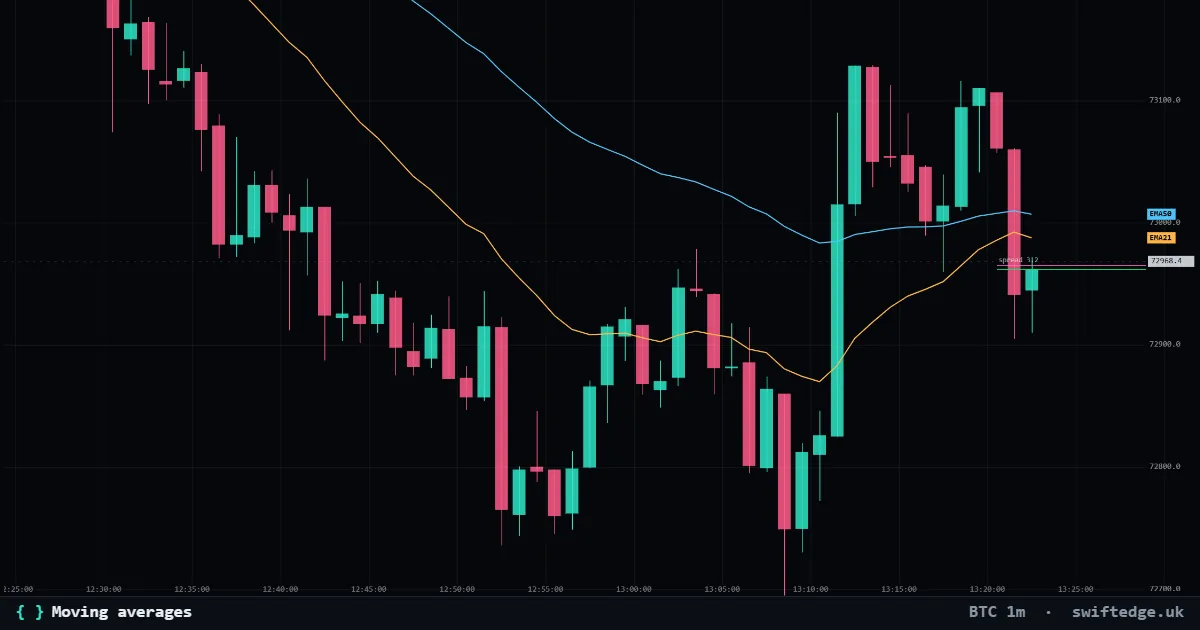
Up to three simple, exponential or weighted moving averages of the close.
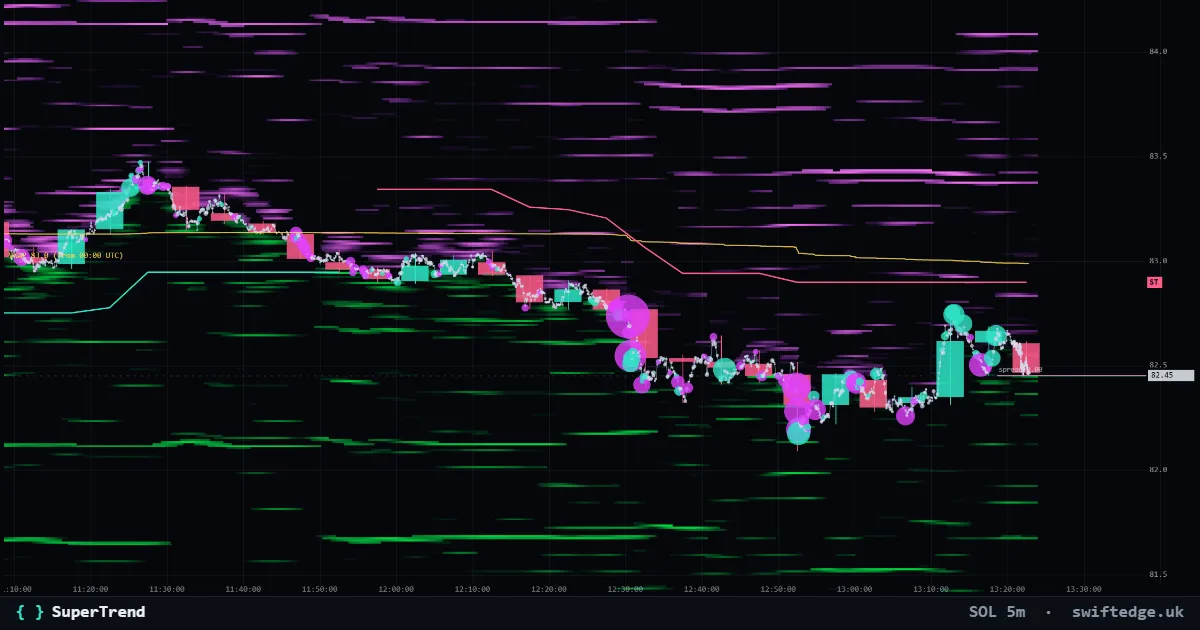
An ATR trailing line under price in uptrends and over price in downtrends; it flips when a candle closes through it.