Community scripts › Built into Depth › Pivot points
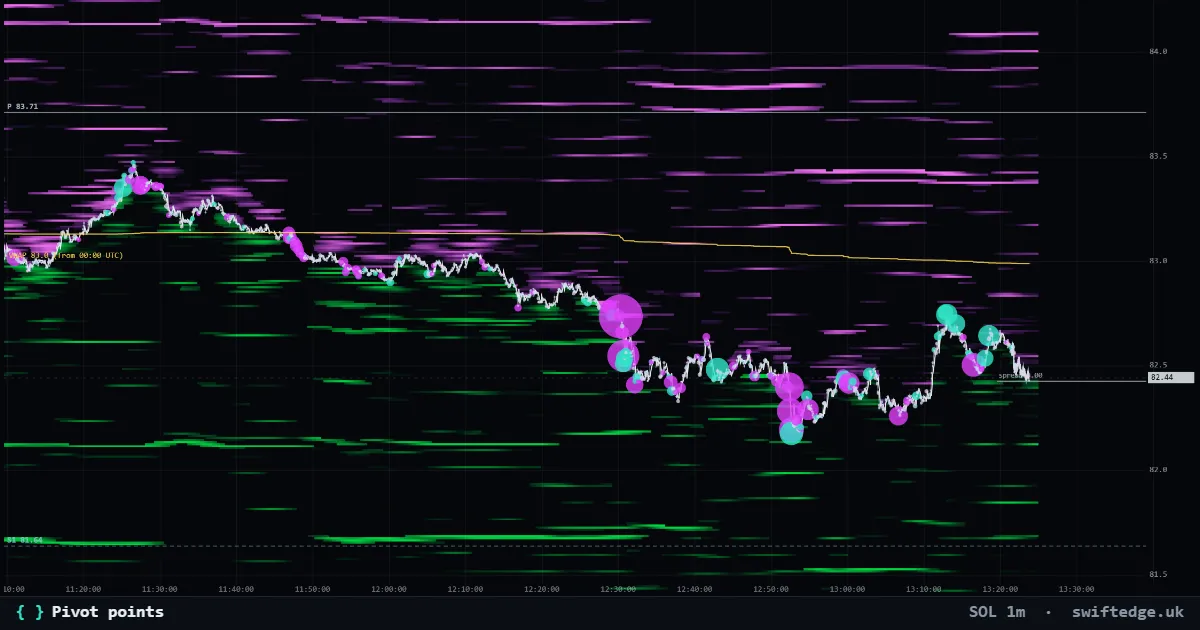
What it shows
Classic, Fibonacci or Camarilla pivots from the previous day's or week's high, low and close.
How to read it
P is the average of the previous period's high, low and close; R and S levels are calculated from it and the range.
How it's calculated
Classic pivots use yesterday's high, low and close on the UTC day: P = (high + low + close) / 3, R1 = 2P - low, S1 = 2P - high, R2 = P + range, S2 = P - range, and R3 and S3 one step further out. Fibonacci pivots place the levels 0.382, 0.618 and 1 range from P; Camarilla pivots build eight levels around the close. Depth calculates them from 1h candles and draws them across the whole day.
What it can't tell you
Pivots are arithmetic from three prices of one day. Many traders watch them, but they are not places where orders are known to rest; the Liquidity heatmap shows those.
Pivot points on 9 markets right now
| Market | Price | S1 · P · R1 | Reading | |
|---|---|---|---|---|
| Bitcoin | 72,070 | S1 73,176 · P 73,977 · R1 74,780 | Price between S3 and S2 | Open chart › |
| Gold | 3,899.33 | S1 3,951.80 · P 4,010.62 · R1 4,040.35 | Price between S3 and S2 | Open chart › |
| Ethereum | 2,012 | S1 2,026 · P 2,064 · R1 2,094 | Price between S2 and S1 | Open chart › |
| Solana | 81.47 | S1 81.64 · P 83.71 · R1 85.30 | Price between S2 and S1 | Open chart › |
| XRP | 1.0303 | S1 1.0349 · P 1.0574 · R1 1.0744 | Price between S2 and S1 | Open chart › |
| US 500 | 7,590.40 | S1 7,527.49 · P 7,586.55 · R1 7,637.95 | Price between P and R1 | Open chart › |
| US 100 | 28,241.2 | S1 27,748.8 · P 28,168.2 · R1 28,509.8 | Price between P and R1 | Open chart › |
| Silver | 50.451 | S1 50.620 · P 51.926 · R1 52.606 | Price between S2 and S1 | Open chart › |
| WTI crude oil | 85.39 | S1 84.27 · P 85.97 · R1 86.98 | Price between S1 and P | Open chart › |
Settings in Depth
| From the previous | day |
| Type | classic |
FAQ
Which day do the pivots use?
The previous UTC day, 00:00 to 24:00 UTC. Weekly pivots use the previous week, Monday to Sunday.
What does 'price between P and R1' mean?
Price is above today's pivot point and below the first resistance level.
Can I switch to Fibonacci or Camarilla pivots?
Yes. The type is a setting, and so is daily or weekly.
More in Classic indicators
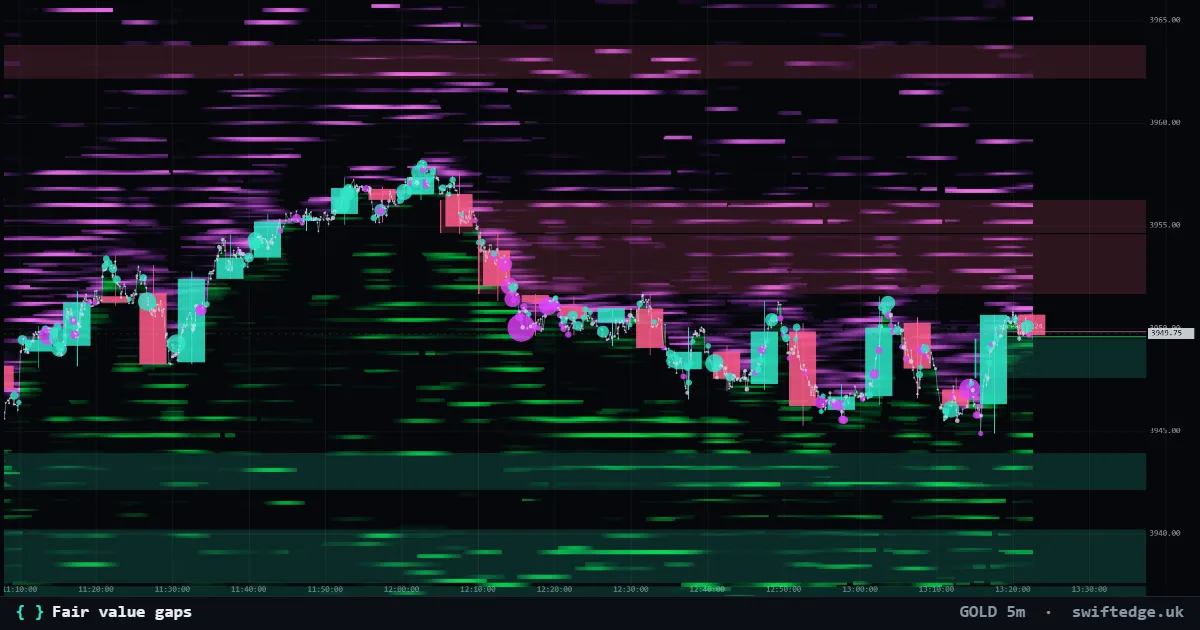
Three-candle gaps where price moved too fast to trade both ways; shown until price fills them.
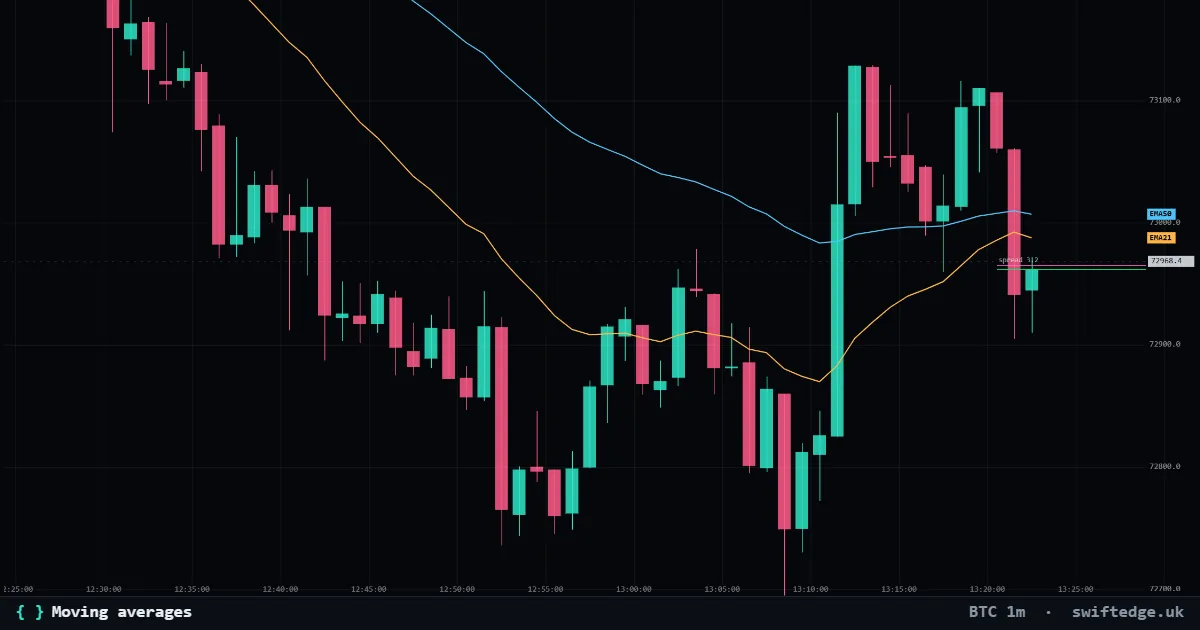
Up to three simple, exponential or weighted moving averages of the close.
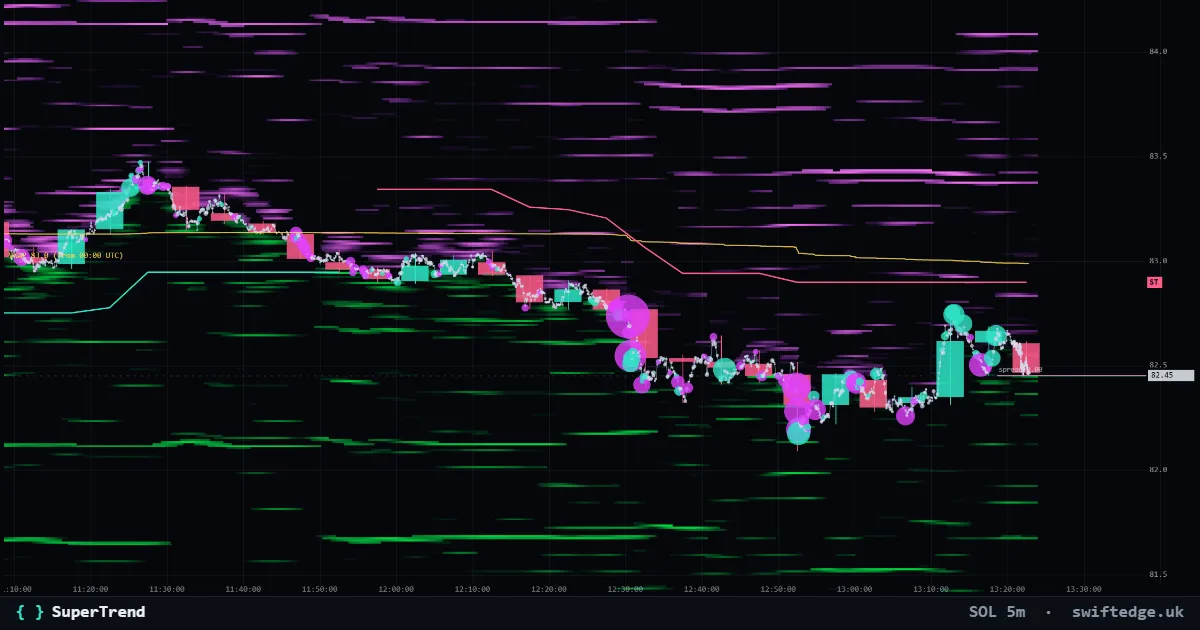
An ATR trailing line under price in uptrends and over price in downtrends; it flips when a candle closes through it.