Community scripts › Built into Depth › S&R with Breaks
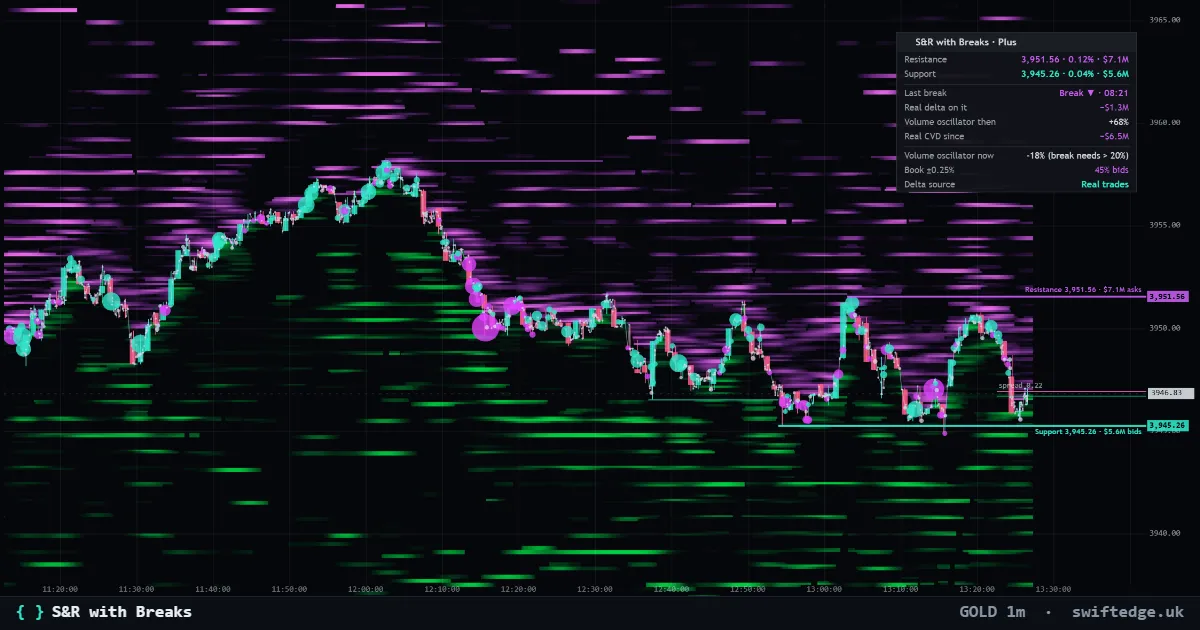
What it shows
Support and resistance from pivot highs and lows with every break marked, the break confirmed by volume as in the original and by the real delta of the breaking candle, and the real orders and liquidations at each level.
How to read it
Support and resistance come from pivot highs and lows. A break is marked when a candle closes through a level; it is confirmed by volume, as in the original, and by the real delta of the breaking candle. Each level shows the real orders and liquidations sitting at it.
What it can't tell you
Pivots need bars on both sides, so a level appears only after those bars have closed.
Settings in Depth
| Levels | |
|---|---|
| Left bars | 15 |
| Right bars | 15 |
| Earlier levels | on |
| Breaks | |
| Show breaks | on |
| Volume threshold (oscillator %) | 20 |
| Wick breaks | on |
| Breaks only when the real delta agrees (Swiftedge) | off |
| Real data | |
| Real orders and liquidations at the levels | on |
| Real delta on each break | on |
FAQ
Why does a level appear late?
A pivot is confirmed only when 15 bars on its right have closed.
How is a break confirmed?
By volume, as in the original script, and by the real delta of the breaking candle.
Can I change the pivot size?
Yes, both left and right bars are settings.
More in Swiftedge Plus
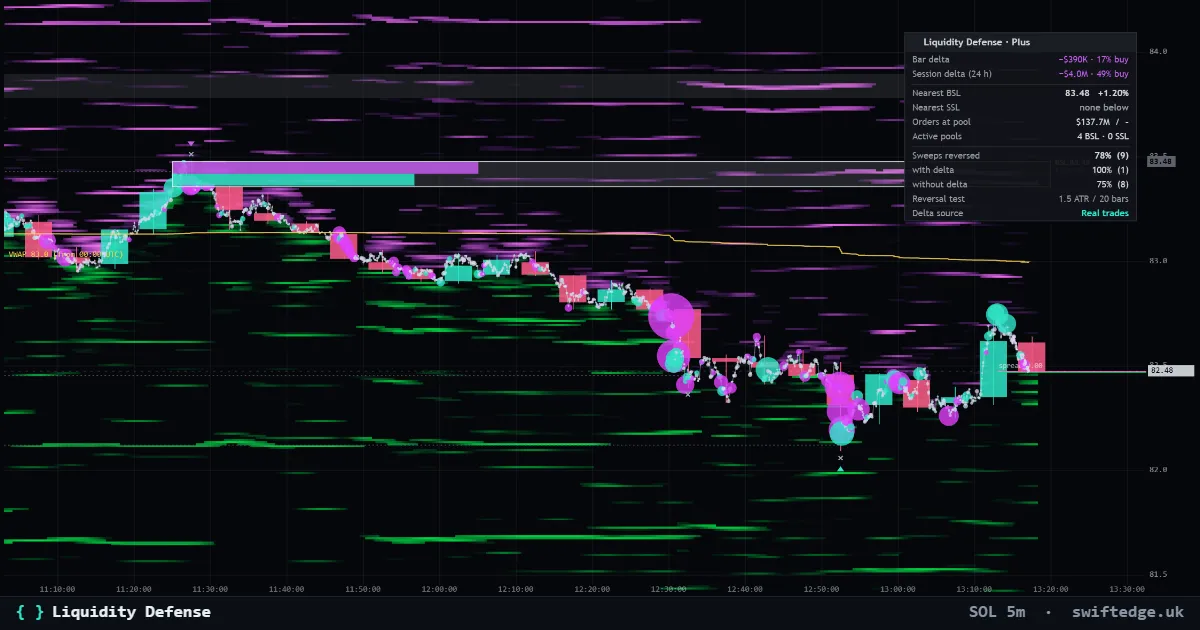
Buy-side and sell-side pools above highs and below lows with formation, defense profile and sweeps, from real trades, with the orders and liquidations at the nearest pools.
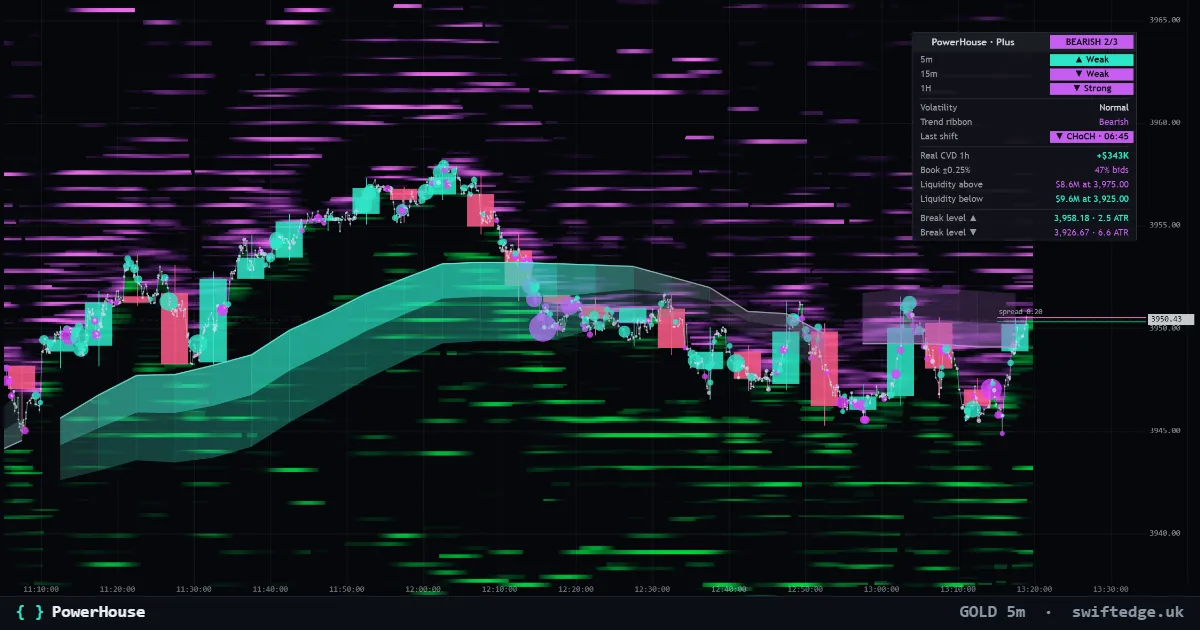
The adaptive trend ribbon, structure shifts (CHoCH and BOS) and a Trend Matrix, with the real walls and liquidation clusters above and below price.
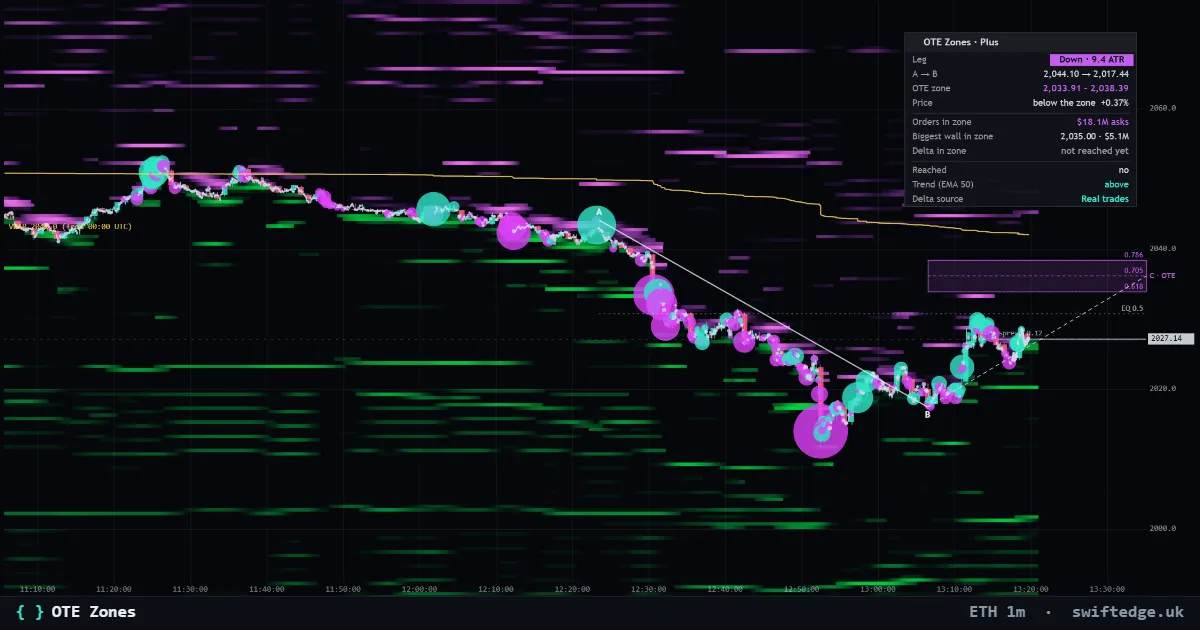
The latest impulse leg A to B and its optimal trade entry zone (0.618 to 0.786), with the real orders and liquidations inside the zone and who traded when price was in it.