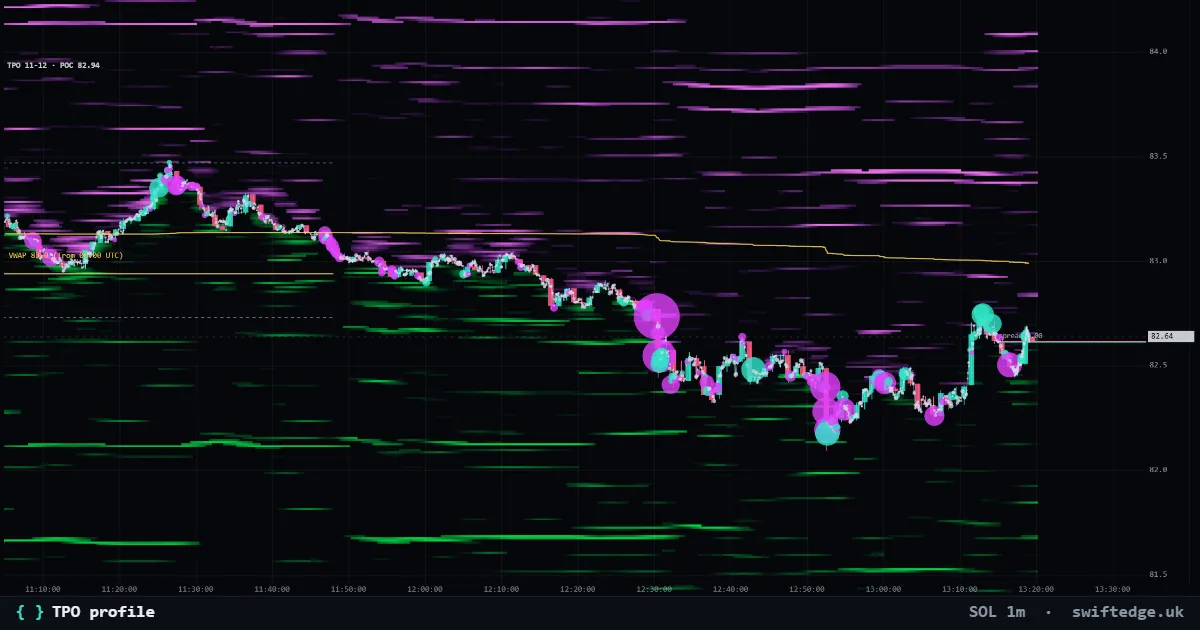
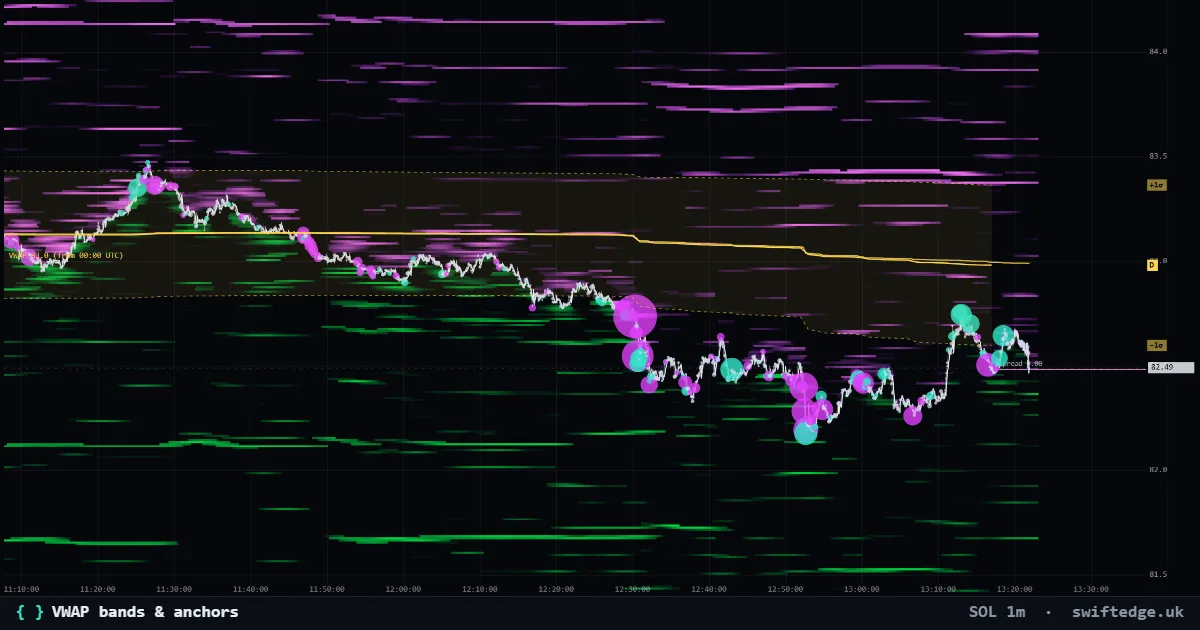
Community scripts › Built into Depth › Volume profile
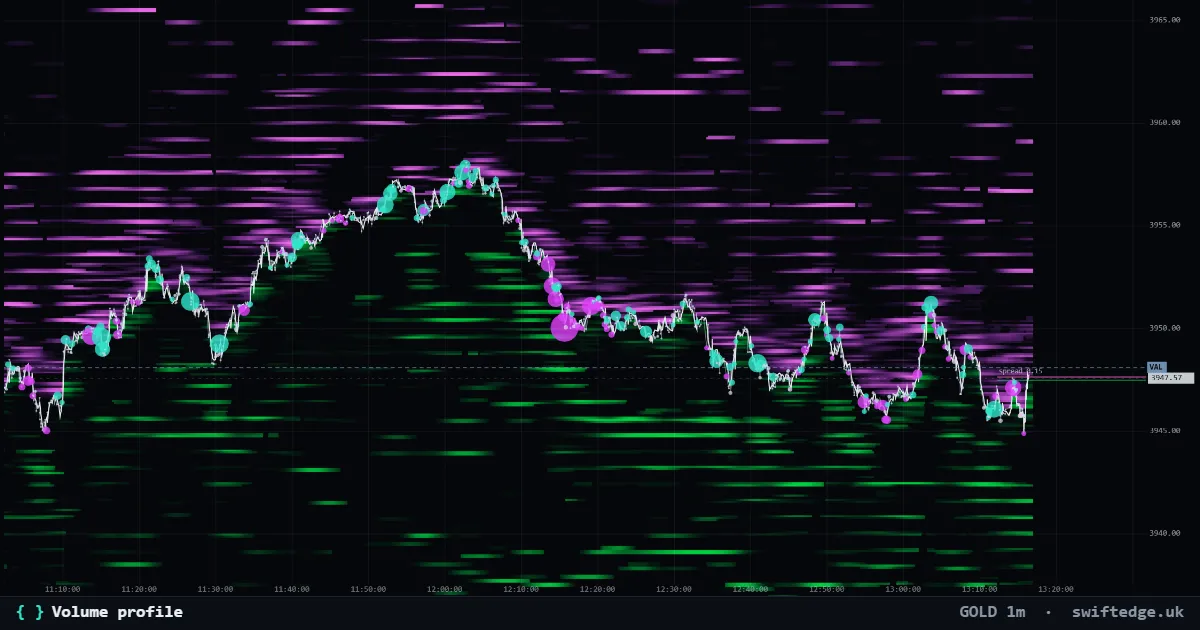
Where volume actually traded, by price. The point of control and the value area are the levels the market keeps returning to.
What it shows
Traded volume at each price per day, session, week, a composite of the last hours or the visible range, with POC, value area and naked POCs.
How to read it
The point of control (POC) is the price with the most volume; the value area is where 70 % of volume traded, from VAL to VAH. A naked POC is a previous POC that price has not traded at since, often watched as a magnet. Show volume, buy and sell, or delta. The last 48 hours come from every trade; the weekly profile spreads 5-minute candle volume over each candle's range. The Volume profile (range) drawing tool makes a profile over any interval you drag. Optional HVN and LVN lines mark the high and low volume nodes: peaks and valleys in the smoothed profile that stand out by a set share of the POC row.
How it's calculated
Volume profile adds up the volume traded at each price for a day (UTC), a session, a week, the last hours or the visible range. The point of control (POC) is the price with the most volume and the value area is where 70 % of it traded, from VAL to VAH. A naked POC is an earlier POC that price has not traded at since.
What it can't tell you
A profile shows where volume traded, not where orders rest now. The weekly profile spreads 5-minute candle volume over each candle's range, so it is less exact than the last 48 hours, which come from every trade.
Settings in Depth
| Profile per | day (UTC) |
| Session starts (UTC, comma separated) | 00:00,07:00,13:30,21:00 |
| Composite: last hours | 24 |
| Rows | auto (from the zoom) |
| Value area % | 70 |
FAQ
What is the point of control?
The price where the most volume traded in the profile's period.
What is a naked POC?
A POC from an earlier period that price has not traded at since. Traders often watch it as a level.
Can I show buy and sell volume?
Yes: volume, buy and sell, or delta.