Community scripts › Built into Depth › Liquidity Defense
Liquidity Defense
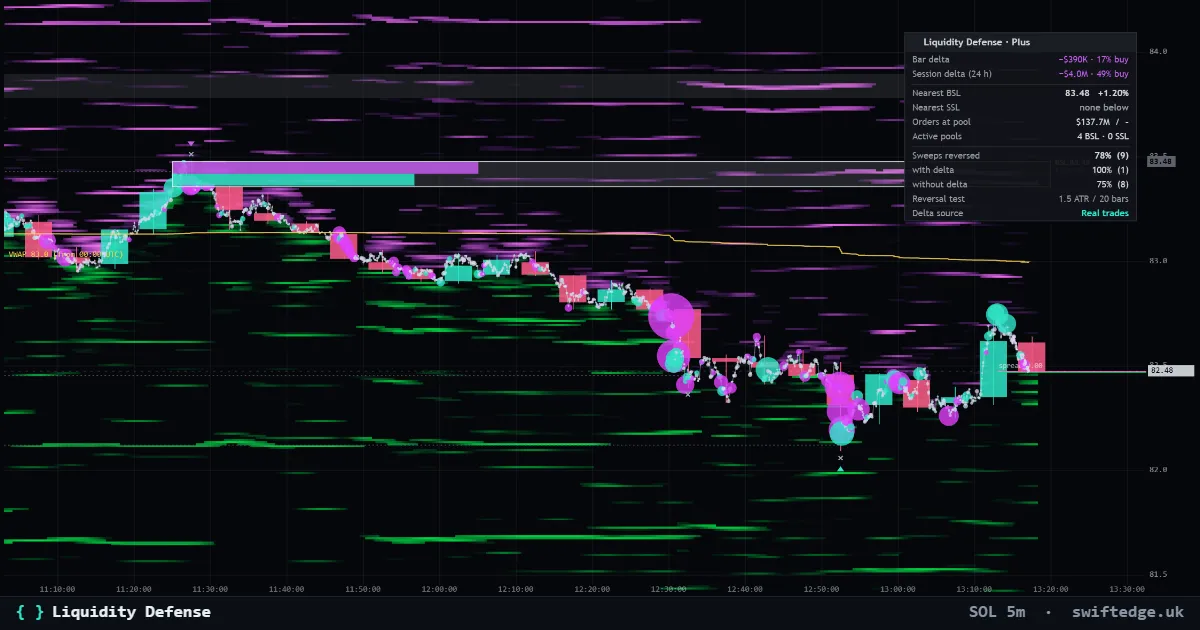
Our flagship Plus indicator: liquidity pools above highs and below lows, with the real orders and liquidations sitting at each pool.
What it shows
Buy-side and sell-side pools above highs and below lows with formation, defense profile and sweeps, from real trades, with the orders and liquidations at the nearest pools.
How to read it
Pools form where several highs or lows line up, because stops and breakout orders gather there. The defense profile shows how much was traded at the pool, and a sweep is marked when price runs through it and closes back. The panel lists the nearest pools with the real orders and liquidations at each one.
What it can't tell you
A pool is where stops are likely to sit, inferred from the chart. The real orders shown are those visible in the book.
Settings in Depth
| Pools | |
|---|---|
| Pivot length | 10 bars |
| Formation (sellers above, buyers below) | on |
| Defense profile (projected right) | on |
| Swept pools as dotted lines | on |
| Sweep marks (×) and reversal triangles | on |
| Real data | |
| Orders and liquidations at the nearest pools | on |
| Liquidations at sweeps | on |
FAQ
What is a liquidity pool?
The area above a swing high or below a swing low, where stop orders and liquidations tend to collect.
What is a sweep?
Price trades through a pool and comes back, taking the orders that sat there.
Can I change the pivot length?
Yes: 5, 10 or 20 bars.
More in Swiftedge Plus
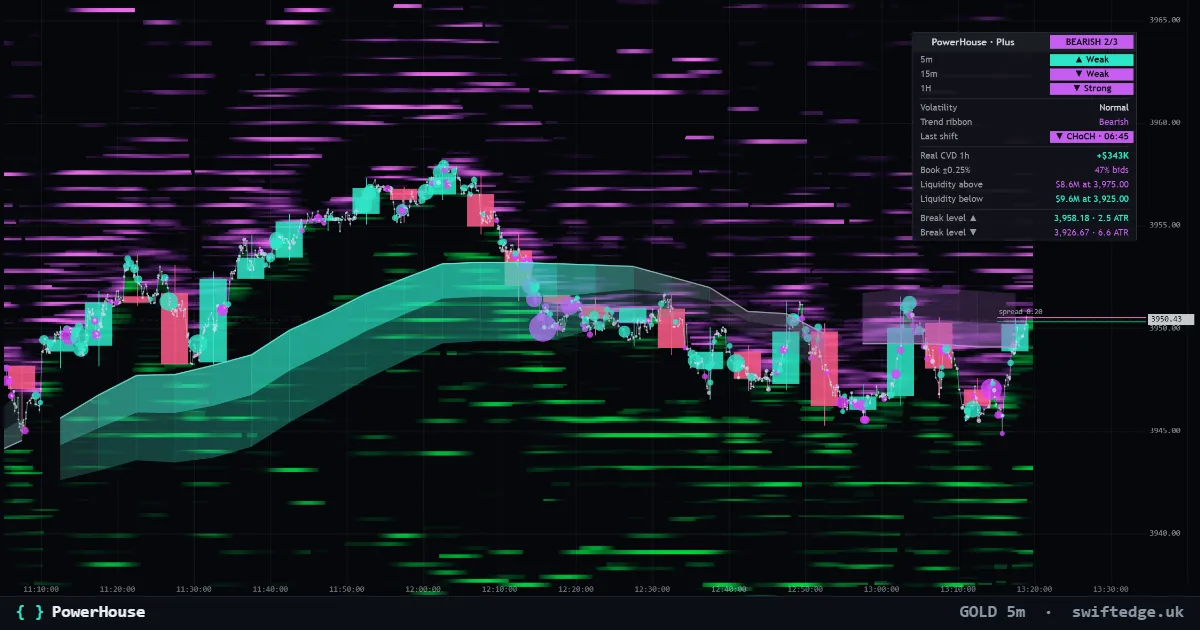
The adaptive trend ribbon, structure shifts (CHoCH and BOS) and a Trend Matrix, with the real walls and liquidation clusters above and below price.
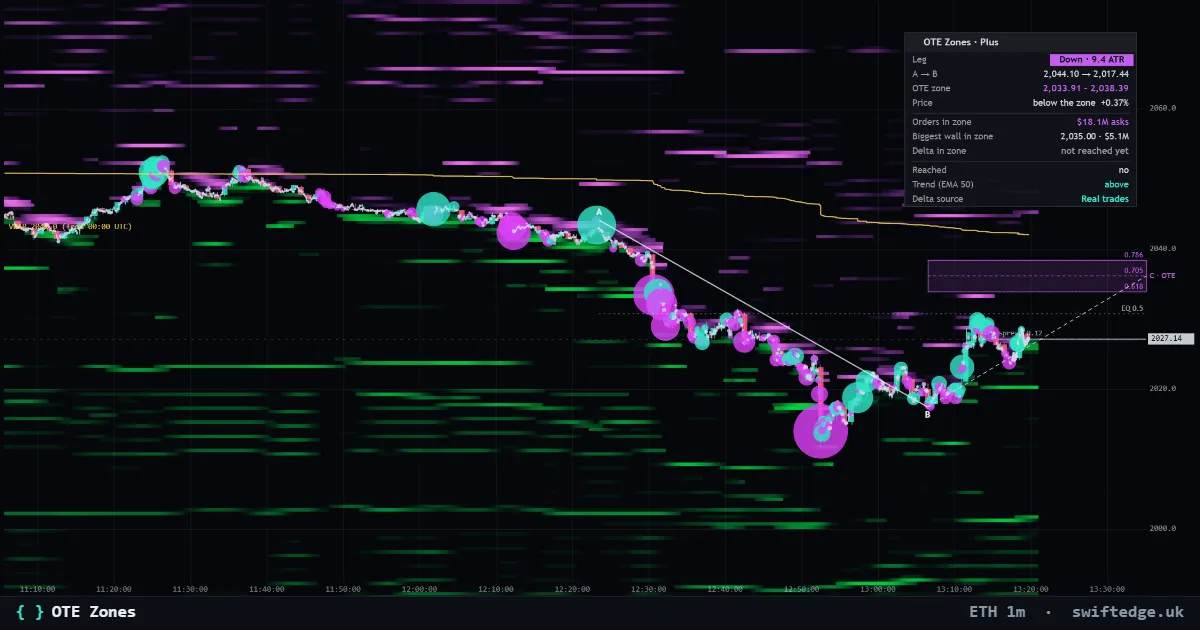
The latest impulse leg A to B and its optimal trade entry zone (0.618 to 0.786), with the real orders and liquidations inside the zone and who traded when price was in it.
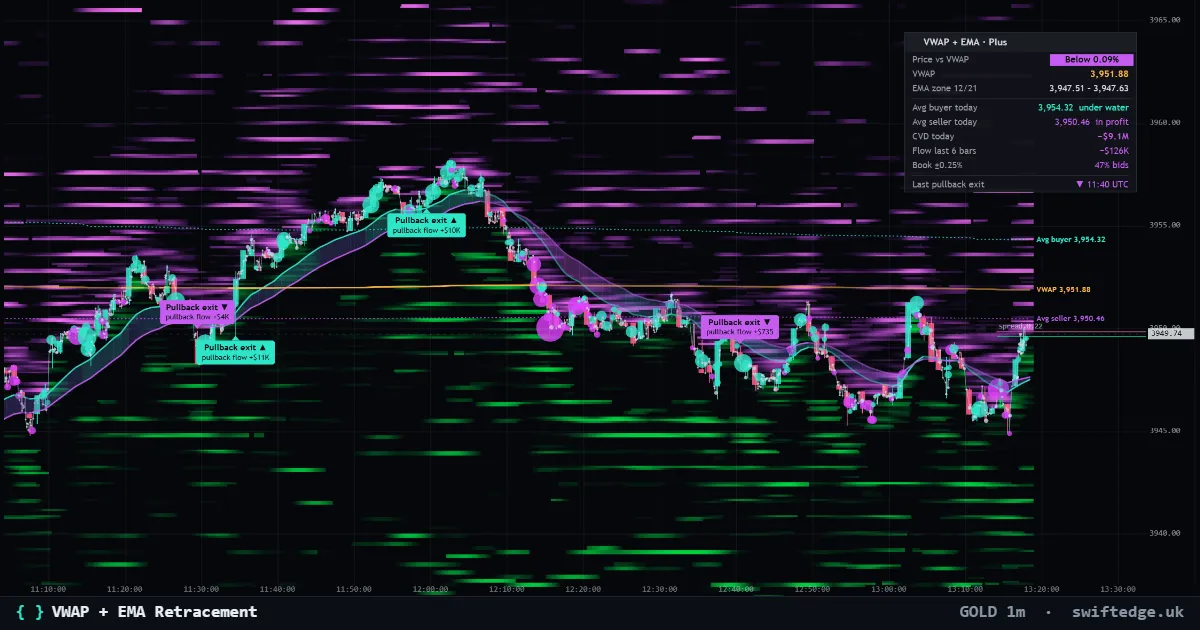
VWAP and the EMA 12/21 zone with pullback exits, the zone colored by real flow and where today's average buyer and seller got in.