Community scripts › Built into Depth › RSI
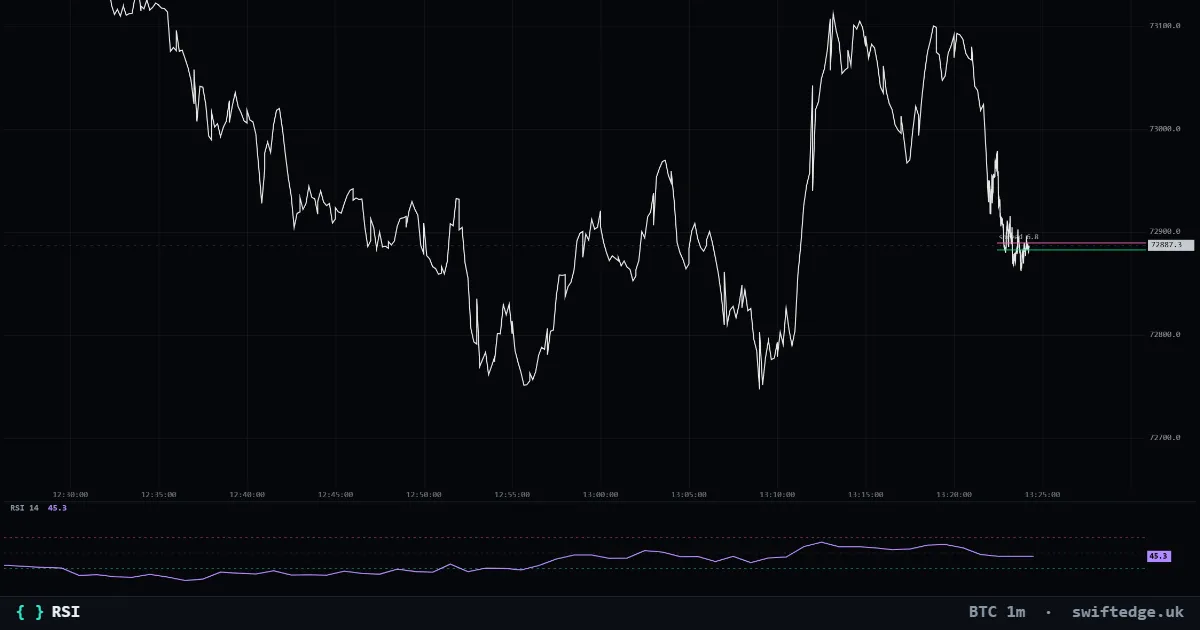
What it shows
Relative strength index (0-100) in a pane, with 70/30 lines and an optional moving average.
How to read it
RSI compares the size of recent up closes with down closes. Above 70 is often called overbought and below 30 oversold; in strong trends it can stay there.
How it's calculated
RSI compares the size of up closes with down closes over 14 candles, each smoothed with Wilder's method: RSI = 100 - 100 / (1 + average gain / average loss), so it runs from 0 to 100. Depth draws it in its own pane with lines at 70 and 30 and an optional moving average.
What it can't tell you
Above 70 or below 30 only says recent closes were one-sided, not that the move has to end. In strong trends RSI can stay there for a long time.
RSI on 9 markets right now
| Market | Price | RSI 14 | Reading | |
|---|---|---|---|---|
| Bitcoin | 72,070 | 22.5 | RSI below 30, falling | Open chart › |
| Gold | 3,899.33 | 24.2 | RSI below 30, rising | Open chart › |
| Ethereum | 2,012 | 28.2 | RSI below 30, rising | Open chart › |
| Solana | 81.47 | 30.7 | RSI between 30 and 70, rising | Open chart › |
| XRP | 1.0303 | 33.0 | RSI between 30 and 70, falling | Open chart › |
| US 500 | 7,590.40 | 53.0 | RSI between 30 and 70, rising | Open chart › |
| US 100 | 28,241.2 | 55.9 | RSI between 30 and 70, rising | Open chart › |
| Silver | 50.451 | 33.0 | RSI between 30 and 70, rising | Open chart › |
| WTI crude oil | 85.39 | 50.4 | RSI between 30 and 70, falling | Open chart › |
Settings in Depth
| Timeframe | the chart's timeframe (or a fixed 1m to 1D) |
| Length | 14 |
| Signal MA length (0 = off) | 0 |
| Upper line | 70 |
| Lower line | 30 |
FAQ
Is RSI above 70 overbought?
It is often called that, but it only means gains have dominated the last 14 candles. The table shows the zone, not a signal.
Does the RSI match other charts?
With the same candles and length 14 it should, because Depth uses the standard Wilder smoothing. A different data source or candle time can give small differences.
Can I add a signal line?
Yes, set the signal MA length above 0.
More in Classic indicators
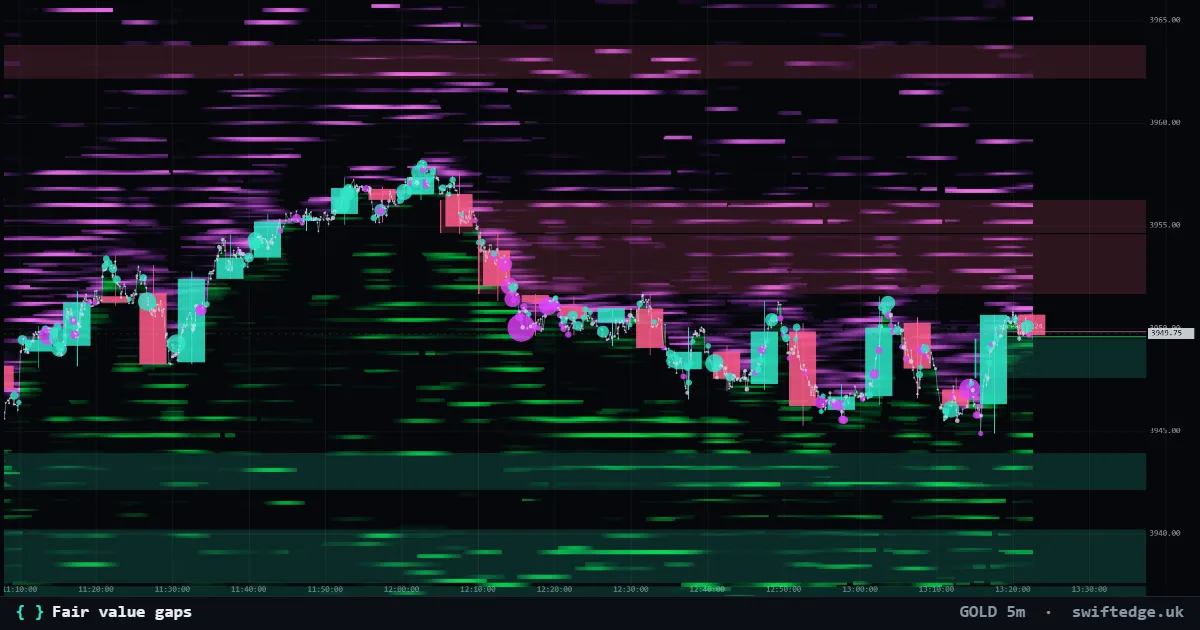
Three-candle gaps where price moved too fast to trade both ways; shown until price fills them.
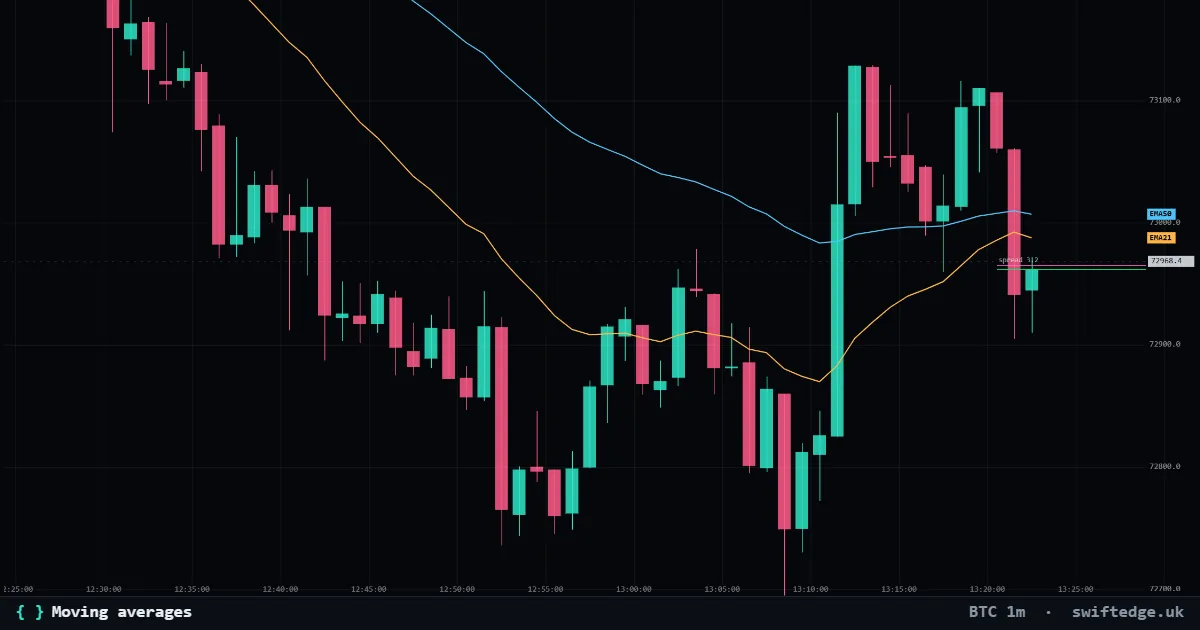
Up to three simple, exponential or weighted moving averages of the close.
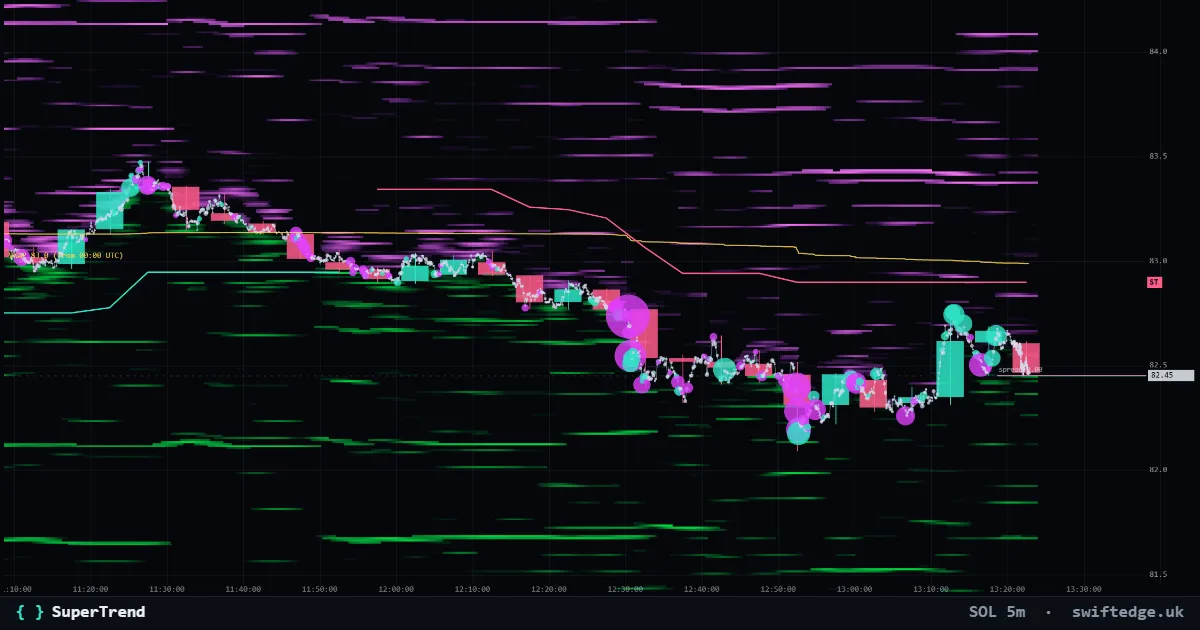
An ATR trailing line under price in uptrends and over price in downtrends; it flips when a candle closes through it.