Community scripts › Built into Depth › Previous day & week levels
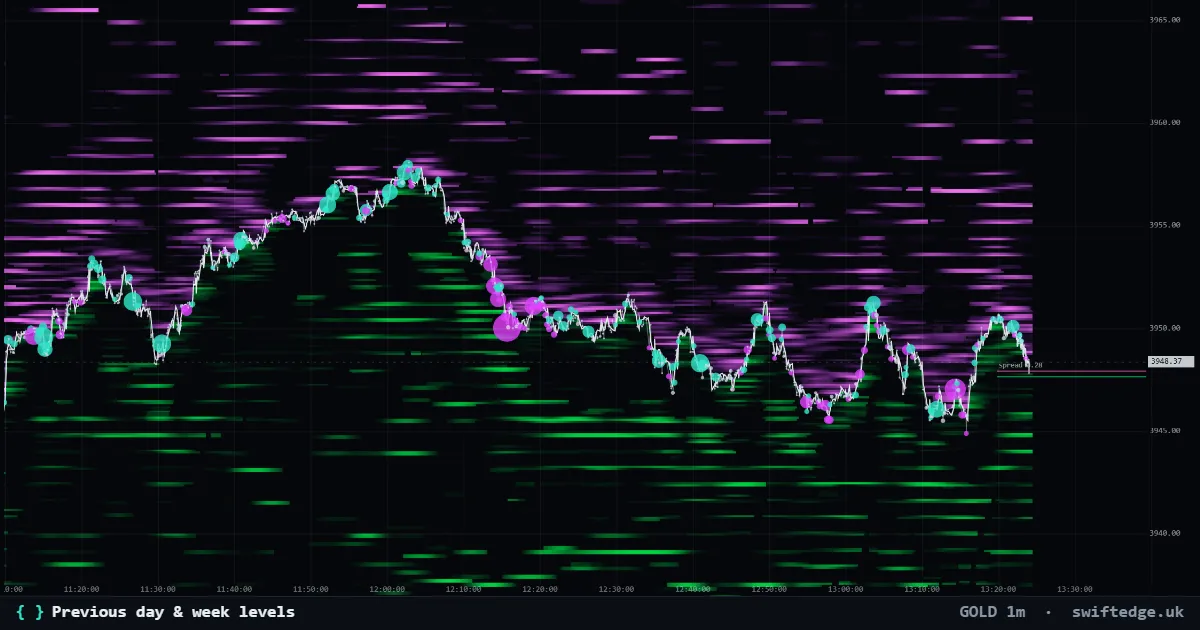
What it shows
Yesterday's and last week's high, low and close, and today's open at 7:00 PM ET (00:00 UTC).
How to read it
Old highs and lows are where many stops and limit orders tend to sit, so price often reacts near them.
How it's calculated
From 1h candles Depth groups each UTC day and week and draws yesterday's high (PDH), low (PDL) and close (PDC), last week's high and low (PWH, PWL) and today's open at 7:00 PM ET (00:00 UTC) (DO). Weeks run from Monday to Sunday.
What it can't tell you
These are prices that already traded. Whether price reacts at them today depends on the orders around them.
Previous day & week levels on 9 markets right now
| Market | Price | Yesterday | Reading | |
|---|---|---|---|---|
| Bitcoin | 72,070 | PDH 74,778 · PDL 73,174 · PDC 73,979 | Price below yesterday's low, below today's open; last week's range 73,413–81,177 | Open chart › |
| Gold | 3,899.33 | PDH 4,069.44 · PDL 3,980.89 · PDC 3,981.53 | Price below yesterday's low, below today's open; last week's range 3,893.99–4,146.96 | Open chart › |
| Ethereum | 2,012 | PDH 2,103 · PDL 2,035 · PDC 2,055 | Price below yesterday's low, below today's open; last week's range 2,055–2,450 | Open chart › |
| Solana | 81.47 | PDH 85.79 · PDL 82.12 · PDC 83.23 | Price below yesterday's low, below today's open; last week's range 85.03–98.16 | Open chart › |
| XRP | 1.0303 | PDH 1.0799 · PDL 1.0404 · PDC 1.0519 | Price below yesterday's low, below today's open; last week's range 1.0874–1.3422 | Open chart › |
| US 500 | 7,590.40 | PDH 7,645.60 · PDL 7,535.14 · PDC 7,578.90 | Price inside yesterday's range, above today's open; last week's range 7,303.20–7,713.90 | Open chart › |
| US 100 | 28,241.2 | PDH 28,587.5 · PDL 27,826.5 · PDC 28,090.5 | Price inside yesterday's range, above today's open; last week's range 26,254.0–28,846.5 | Open chart › |
| Silver | 50.451 | PDH 53.232 · PDL 51.247 · PDC 51.300 | Price below yesterday's low, below today's open; last week's range 48.650–53.512 | Open chart › |
| WTI crude oil | 85.39 | PDH 87.67 · PDL 84.97 · PDC 85.28 | Price inside yesterday's range, above today's open; last week's range 86.61–102.56 | Open chart › |
Settings in Depth
| Previous day high / low / close | on |
| Previous week high / low | on |
| Today's open (7:00 PM ET · 00:00 UTC) | on |
FAQ
What do PDH, PDL and PDC mean?
Previous day high, previous day low and previous day close, on the UTC day.
Why the UTC day?
Depth uses the same UTC day for every market, so the levels are identical for everyone, wherever they are.
Can I hide some of the levels?
Yes. The previous day, the previous week and today's open are separate settings.
More in Classic indicators
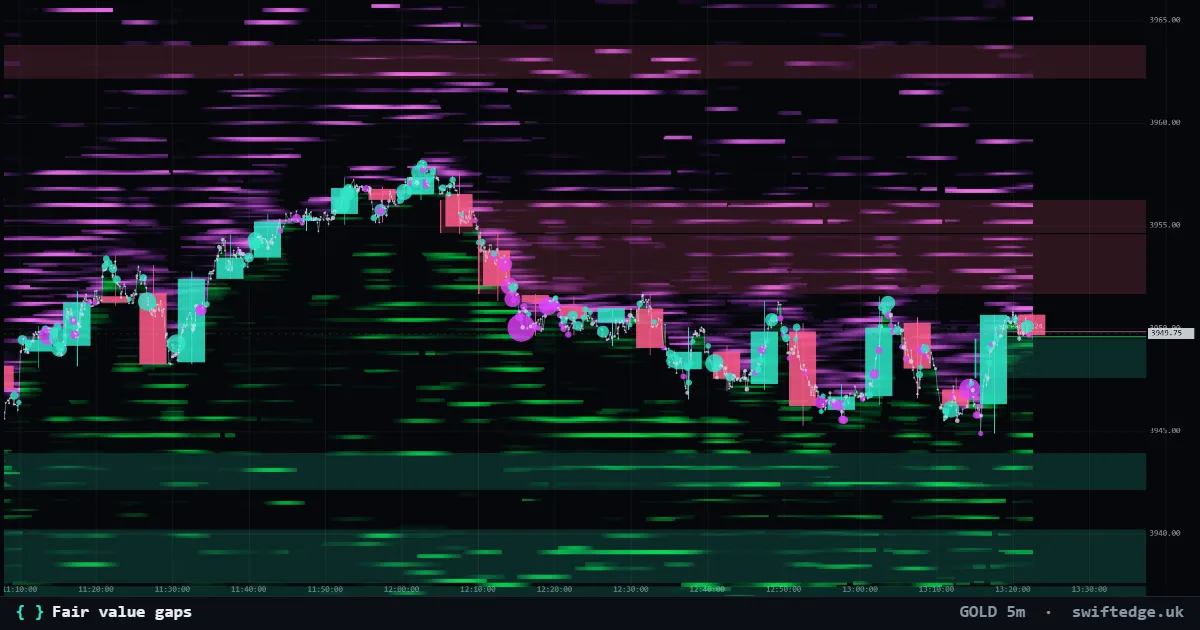
Three-candle gaps where price moved too fast to trade both ways; shown until price fills them.
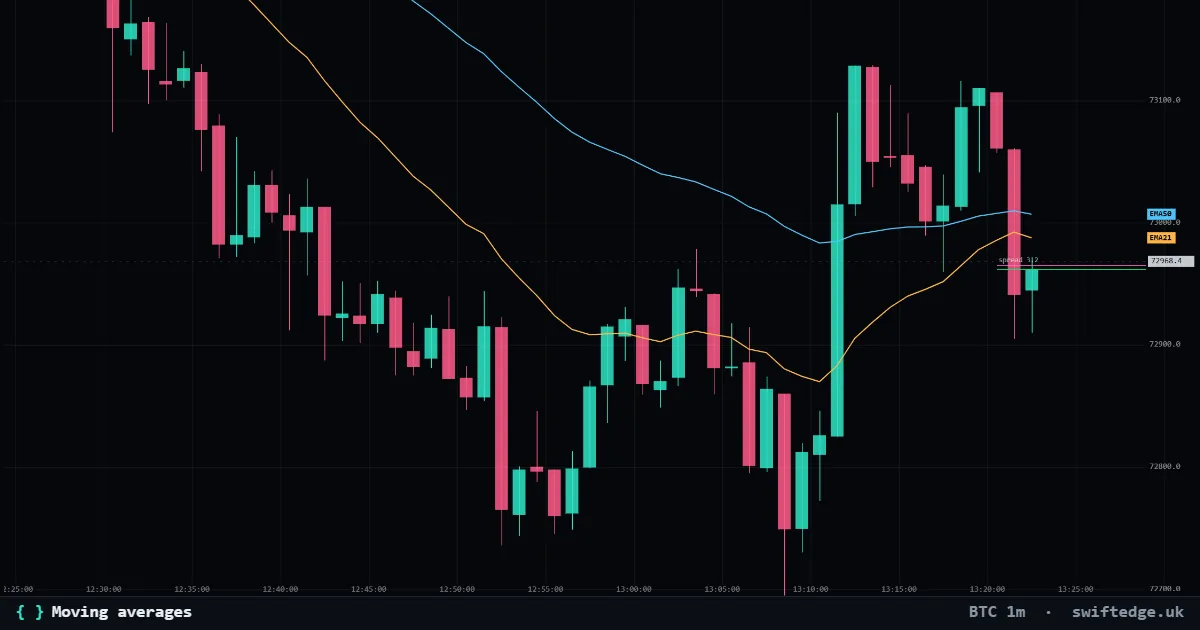
Up to three simple, exponential or weighted moving averages of the close.
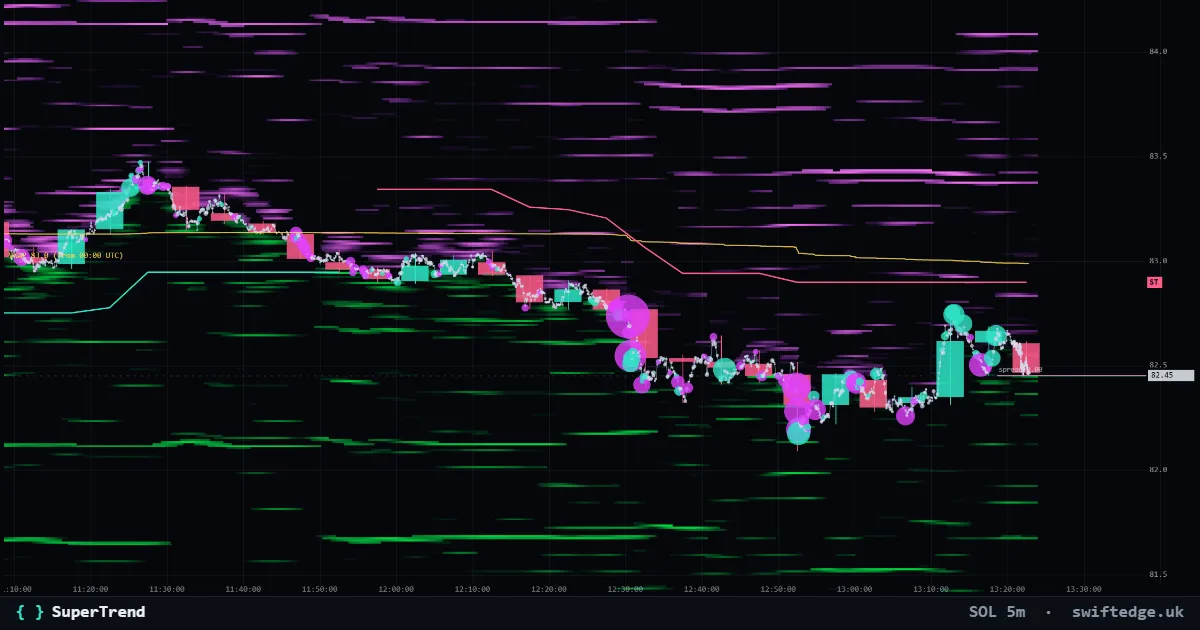
An ATR trailing line under price in uptrends and over price in downtrends; it flips when a candle closes through it.