Community scripts › Built into Depth › MACD
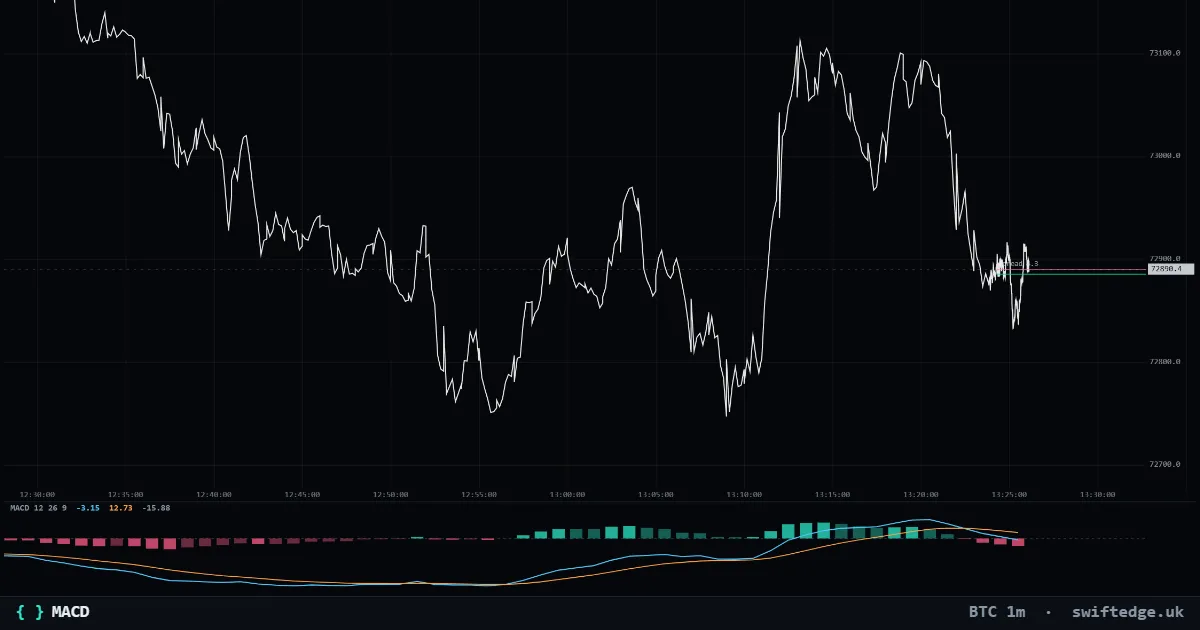
What it shows
Moving average convergence divergence in a pane: the MACD line, signal line and histogram.
How to read it
MACD is the difference between a fast and a slow EMA; the histogram is MACD minus its signal line.
How it's calculated
MACD is the 12-period EMA of the close minus the 26-period EMA. The signal line is a 9-period EMA of MACD, and the histogram is MACD minus the signal line. The values are in the market's own price.
What it can't tell you
MACD is built from averages of the close, so it lags, and it crosses its signal line often in a sideways market.
MACD on 9 markets right now
| Market | Price | MACD / signal / histogram | Reading | |
|---|---|---|---|---|
| Bitcoin | 72,070 | -366.8 / -203.2 / -163.6 | MACD below the signal line, histogram growing; MACD below zero | Open chart › |
| Gold | 3,899.33 | -28.34 / -23.07 / -5.27 | MACD below the signal line, histogram growing; MACD below zero | Open chart › |
| Ethereum | 2,012 | -12.5 / -8.4 / -4.1 | MACD below the signal line, histogram growing; MACD below zero | Open chart › |
| Solana | 81.47 | -0.55 / -0.37 / -0.18 | MACD below the signal line, histogram growing; MACD below zero | Open chart › |
| XRP | 1.0303 | -0.0067 / -0.0055 / -0.0013 | MACD below the signal line, histogram growing; MACD below zero | Open chart › |
| US 500 | 7,590.40 | 0.50 / 2.99 / -2.49 | MACD below the signal line, histogram shrinking; MACD above zero | Open chart › |
| US 100 | 28,241.2 | -6.7 / 3.3 / -10.0 | MACD below the signal line, histogram shrinking; MACD below zero | Open chart › |
| Silver | 50.451 | -0.401 / -0.313 / -0.088 | MACD below the signal line, histogram growing; MACD below zero | Open chart › |
| WTI crude oil | 85.39 | -0.10 / -0.15 / 0.05 | MACD above the signal line, histogram growing; MACD below zero | Open chart › |
Settings in Depth
| Timeframe | the chart's timeframe (or a fixed 1m to 1D) |
| Fast length | 12 |
| Slow length | 26 |
| Signal length | 9 |
FAQ
What does 'histogram growing' mean?
The distance between MACD and its signal line got larger since the previous candle.
Why are the numbers so different between markets?
MACD is measured in price, so the Bitcoin MACD in dollars is naturally far larger than the one on XRP.
Can I change 12, 26 and 9?
Yes, the fast, slow and signal lengths are all settings.
More in Classic indicators
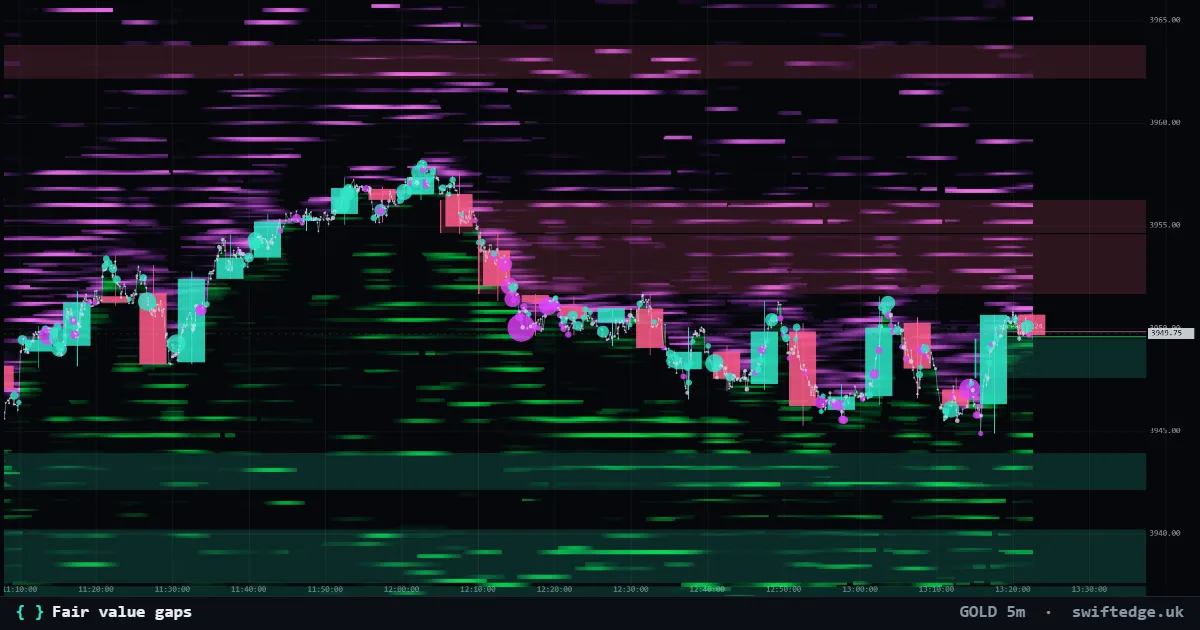
Three-candle gaps where price moved too fast to trade both ways; shown until price fills them.
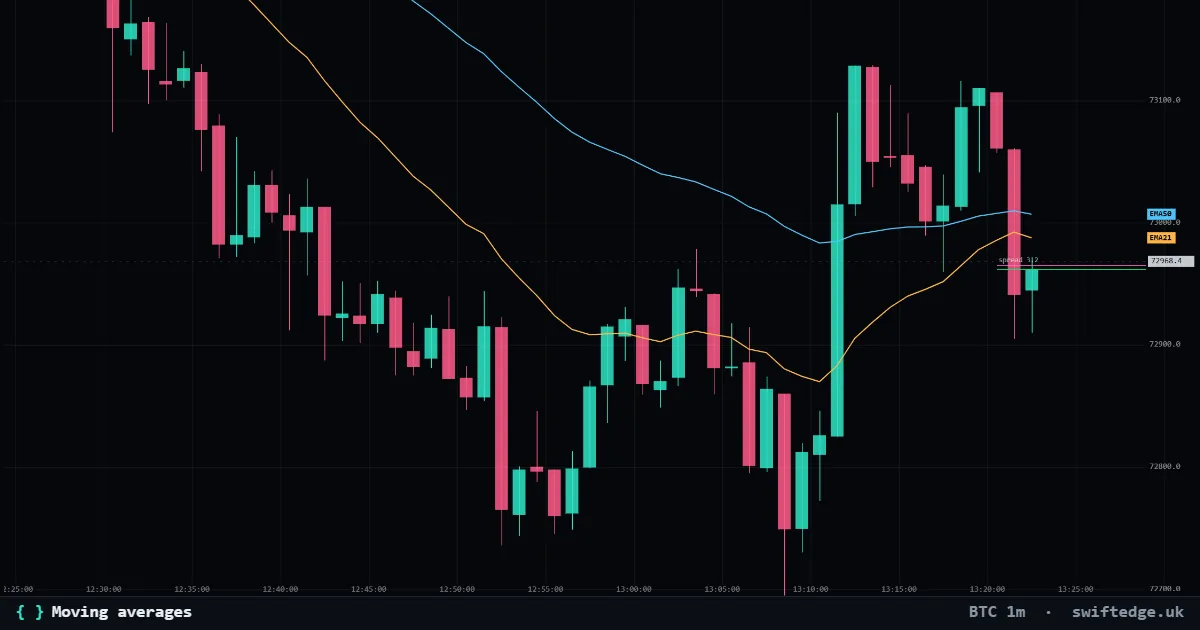
Up to three simple, exponential or weighted moving averages of the close.
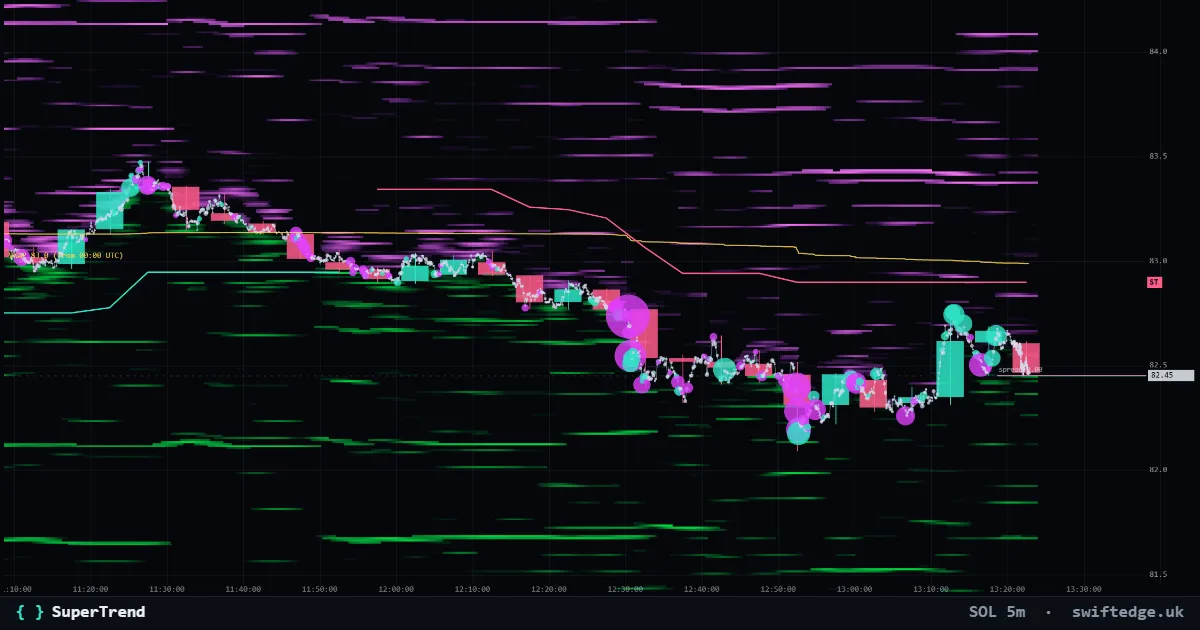
An ATR trailing line under price in uptrends and over price in downtrends; it flips when a candle closes through it.