Community scripts › Built into Depth › CVD divergence
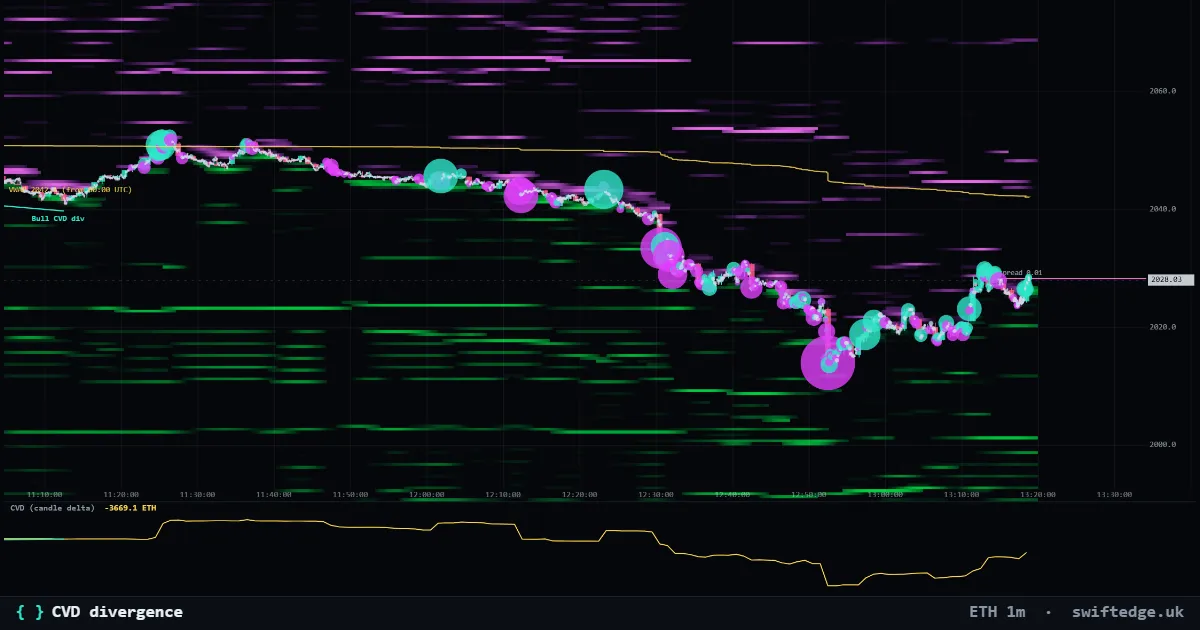
Price makes a new high or low and cumulative delta does not: a quick read on whether aggressive flow agrees with the move.
What it shows
Marks where price made a higher high (or lower low) while cumulative volume delta did not, on the chart and in a CVD pane, with an optional alert.
How to read it
CVD adds up aggressive buying minus selling per candle (from the taker side of every trade). When price makes a new high but CVD makes a lower high, the push was done with less aggressive buying: a bearish divergence; the opposite at lows is bullish. Hidden divergences (optional) are the trend-continuation version. Divergences are context, not timing signals.
How it's calculated
CVD adds up aggressive buying minus aggressive selling per candle. Depth finds swing highs and lows with 5 candles on each side and compares two swings at most 60 candles apart: a higher high in price with a lower high in CVD is a bearish divergence; the opposite at lows is bullish.
What it can't tell you
A divergence is context, not timing. Price can keep going while CVD disagrees.
Settings in Depth
| Timeframe | the chart's timeframe (or a fixed 1m to 1D) |
| Swing size (candles each side) | 5 |
| Max candles between the two swings | 60 |
| Also hidden divergences (trend continuation) | off |
FAQ
What is a hidden divergence?
The trend-continuation version: a higher low in price with a lower low in CVD, or the reverse. It is off by default.
Can I get an alert?
Yes. The indicator can alert you in the browser when a new divergence appears.
Where does CVD come from?
From the taker side of every trade, added up per candle.
More in Order flow
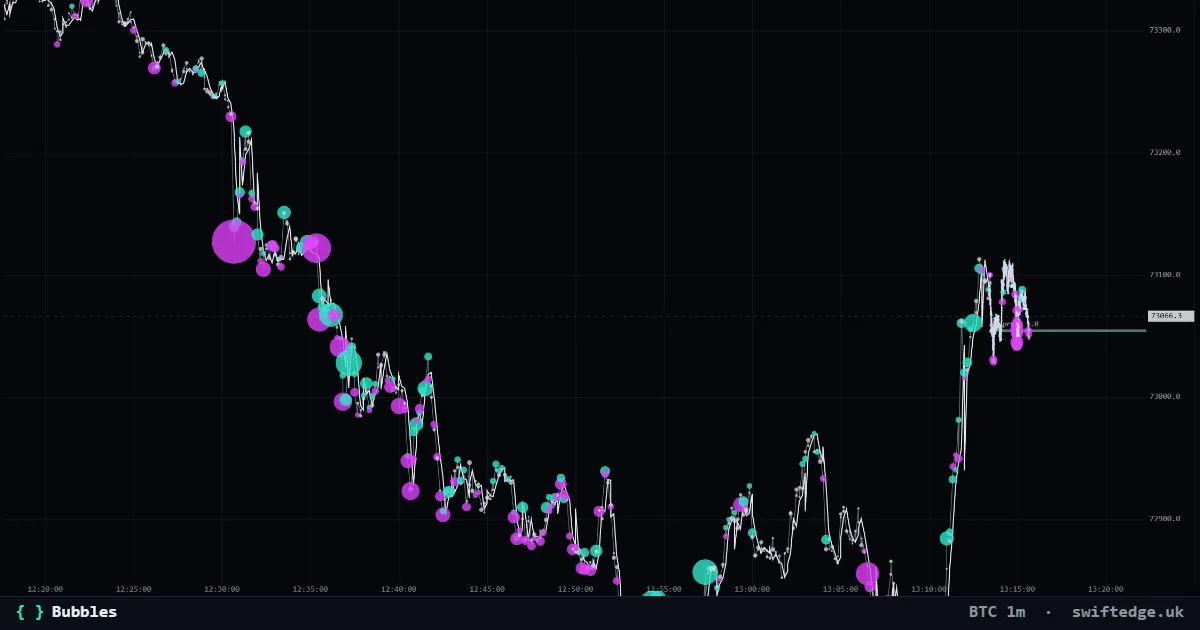
Every trade as a bubble: teal for aggressive buys, violet for aggressive sells; the size is the volume.
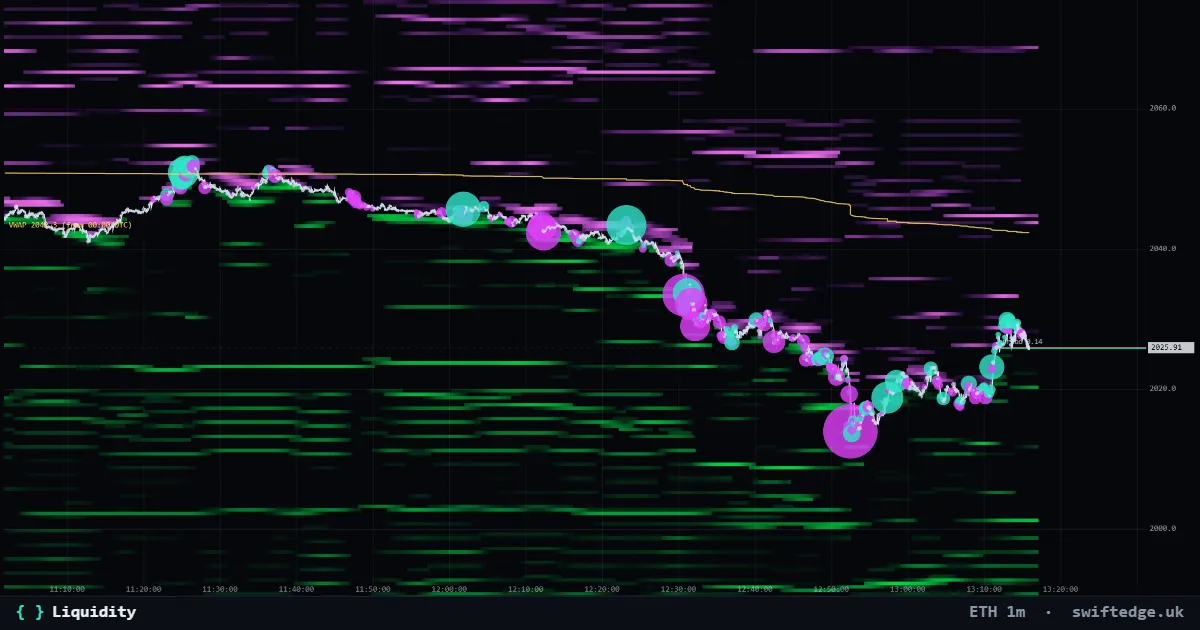
Resting limit orders in the order book by price and time: green bids below price, violet asks above. Brighter means more size.
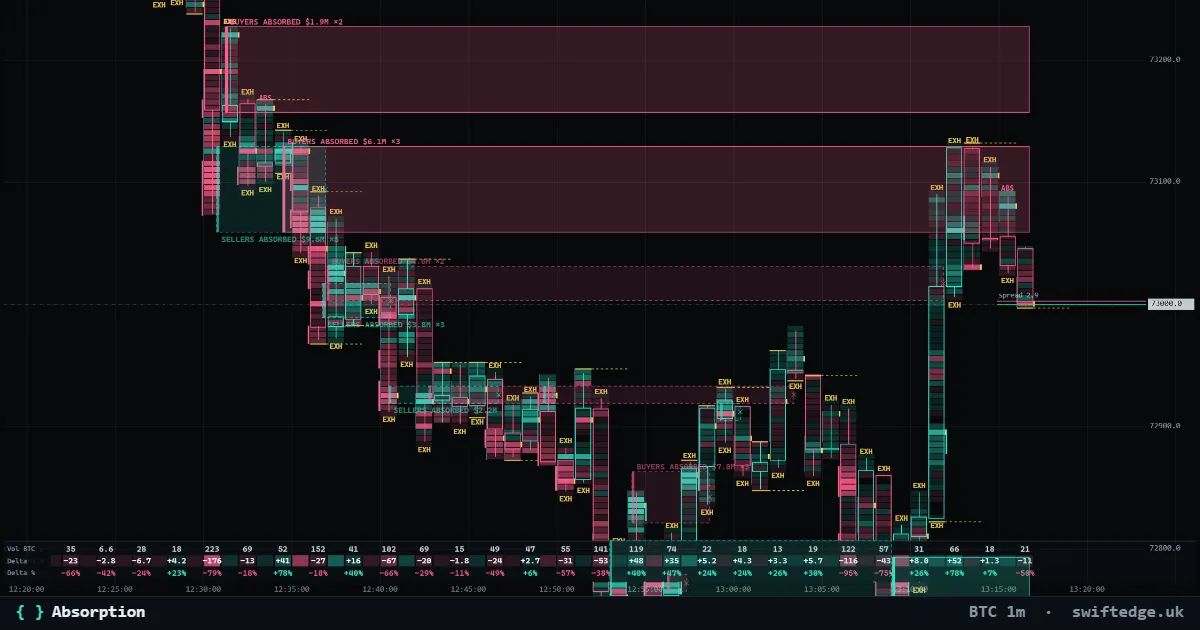
Zones where heavy aggressive selling (or buying) hit a price level and price did not get through; the zone runs until price trades past it.