PowerHouse SwiftEdge AI
Break-of-structure and change-of-character signals with momentum, volume and trend filters, plus a seven-timeframe trend matrix.
67.5K views3.5K boosts
View on TradingView
Depth streams the live Bitcoin futures order book as a heatmap: where size is resting, where it trades, and where it disappears. Updated four times a second, in your browser.
Swiftedge Depth
A candle tells you where price went. Depth shows the orders that pushed it there, the walls it stopped at, and the size that got absorbed along the way.
Resting orders out to 2 % from price, painted by size, so walls and gaps stand out at a glance.
Every print, sized by volume and coloured by who crossed the spread. Large executions light up across the chart.
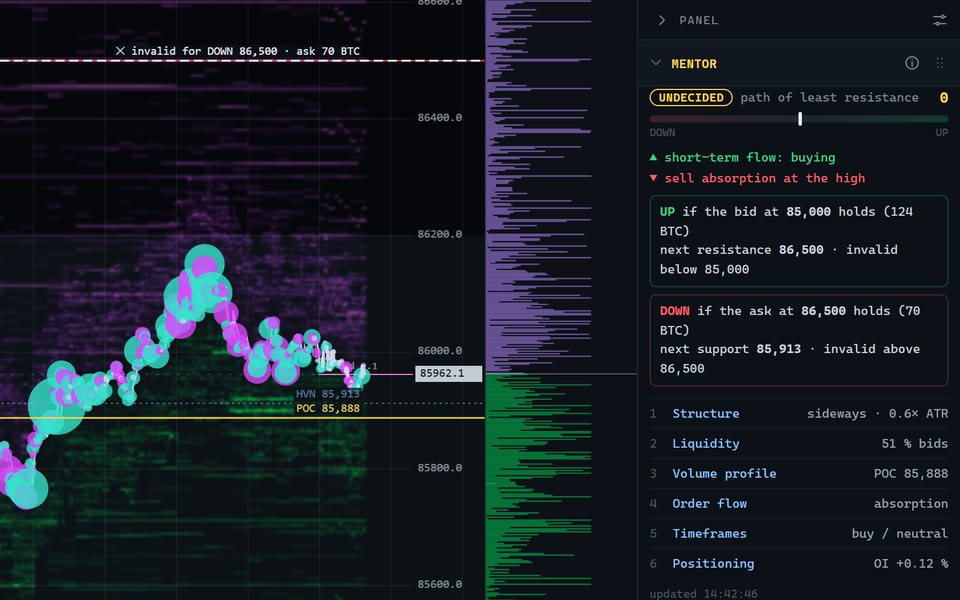
A seven-step read of structure, liquidity, volume profile, order flow, timeframes and positioning — with the level that invalidates it.
Opening ranges for Tokyo, London and New York with relative volume, breakout bands, day type and historical hit rates.
Trend lines, Fibonacci, channels, shapes, text and long/short positions — saved in your browser, pinned to price and time.
Scroll back through the last 24 hours and zoom all the way in to the raw book, at the same precision as live.
For TradingView
The same ideas, on your own charts. Published on TradingView, built for crypto, forex, indices and futures.
Break-of-structure and change-of-character signals with momentum, volume and trend filters, plus a seven-timeframe trend matrix.
Trend pullbacks made visible: signals fire when price retraces into the 12/21 EMA zone on the right side of VWAP and a strong candle closes back out, each with a confidence score.
A Nadaraya-Watson envelope scaled by ATR marks dynamic support and resistance, with RSI confirming overbought and oversold touches before a signal is shown.
Swing highs and lows become a heatmap of likely liquidity: buy-side pools below price, sell-side above, each marked with a bubble sized by the volume behind it.
Trend-following with ICT structure: high/low SMAs define the trend, and signals fire only when price breaks a higher-timeframe BOS or MSS level in the same direction.
Swing pivots with the optimal-trade-entry zone (0.618–0.786), a trend filter and Fibonacci extension targets.
See all 34 scripts on TradingView Figures from TradingView, September 2026
FAQ
Swiftedge Depth is a free, browser-based order flow tool for Bitcoin. It shows the live BTCUSDT futures order book as a heatmap, draws every trade as a bubble sized by volume, and adds a built-in market read (Mentor), session levels (Session Orbs) and 24 drawing tools. It updates four times a second and needs no download or account.
An order book heatmap shows resting limit orders over time. Each price level is coloured by how much size is waiting there: bright bands are large orders (walls), dark areas are thin liquidity. In Swiftedge Depth, green shows buy orders below price and violet shows sell orders above it, so you can see where price may stall, where liquidity gets pulled, and where large size is absorbed.
Each bubble is an executed trade. Its size shows the volume and its colour shows who crossed the spread: green for aggressive buyers, violet for aggressive sellers. Clusters of large bubbles at a level often mark absorption or a breakout attempt.
Yes. Swiftedge Depth is free during the public beta, with no sign-up. A paid Premium plan with extra features is planned for later; the free version will stay available.
Swiftedge Depth is a free, browser-based option for Bitcoin: a live order book heatmap with trade bubbles, market analysis and drawing tools, without installing software or paying a subscription. It currently covers BTCUSDT perpetual futures only.
Bitcoin perpetual futures (BTCUSDT) from Binance USD-M futures: the order book out to about 2 % from price, every trade, and up to 24 hours of history that you can zoom into down to the raw book.
Yes. On phones and tablets the chart fills the screen: drag to scroll, pinch to zoom time or price, double-tap to return to live, and draw with your finger. The panel opens as a drawer from the bottom.
No. Swiftedge Depth shows market data and descriptive analysis for information and education. It does not give buy or sell recommendations, and trading involves substantial risk of loss.
Free during the beta