Community scripts › Built into Depth › Keltner Channels
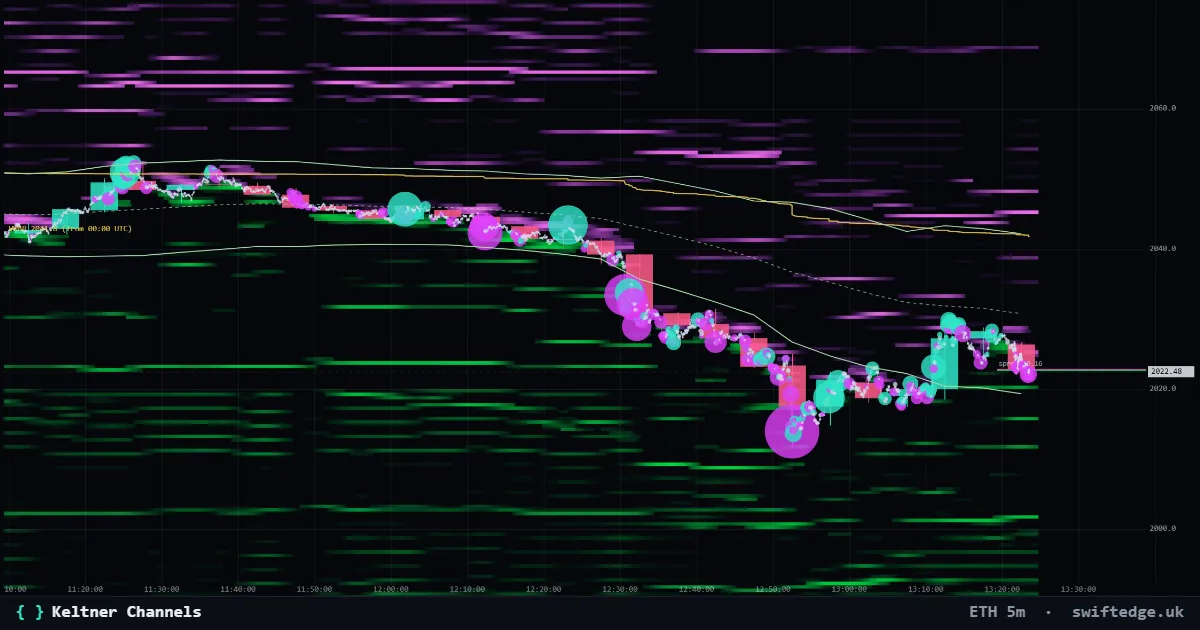
What it shows
An EMA with bands a multiple of the average true range away.
How to read it
Like Bollinger Bands but based on ATR, so the channel width follows the candle range instead of the close's standard deviation.
How it's calculated
The middle line is a 20-period EMA of the close. The upper and lower lines sit 2 average true ranges above and below it, with the ATR smoothed over 10 candles (Wilder's method). Because true range uses the full candle, including any gap from the previous close, the channel follows volatility more smoothly than Bollinger Bands.
What it can't tell you
The channel is a volatility envelope, not a target. In a strong move price can ride along one edge for a long time.
Keltner Channels on 9 markets right now
| Market | Price | Upper / middle / lower | Reading | |
|---|---|---|---|---|
| Bitcoin | 72,070 | 74,333 / 73,358 / 72,384 | Price below the lower band; the channel are 2.66 % of price wide | Open chart › |
| Gold | 3,899.33 | 4,003.57 / 3,960.89 / 3,918.22 | Price below the lower band; the channel are 2.15 % of price wide | Open chart › |
| Ethereum | 2,012 | 2,084 / 2,042 / 2,001 | Price in the lower half of the channel (position 0.14); the channel are 4.06 % of price wide | Open chart › |
| Solana | 81.47 | 84.56 / 82.88 / 81.19 | Price in the lower half of the channel (position 0.08); the channel are 4.06 % of price wide | Open chart › |
| XRP | 1.0303 | 1.0674 / 1.0458 / 1.0242 | Price in the lower half of the channel (position 0.14); the channel are 4.13 % of price wide | Open chart › |
| US 500 | 7,590.40 | 7,624.56 / 7,585.95 / 7,547.33 | Price in the upper half of the channel (position 0.56); the channel are 1.02 % of price wide | Open chart › |
| US 100 | 28,241.2 | 28,419.5 / 28,148.0 / 27,876.6 | Price in the upper half of the channel (position 0.67); the channel are 1.93 % of price wide | Open chart › |
| Silver | 50.451 | 52.151 / 51.294 / 50.437 | Price in the lower half of the channel (position 0.01); the channel are 3.34 % of price wide | Open chart › |
| WTI crude oil | 85.39 | 86.76 / 85.30 / 83.83 | Price in the upper half of the channel (position 0.53); the channel are 3.44 % of price wide | Open chart › |
Settings in Depth
| Timeframe | the chart's timeframe (or a fixed 1m to 1D) |
| EMA length | 20 |
| ATR length | 10 |
| ATR multiple | 2 |
FAQ
How are Keltner Channels different from Bollinger Bands?
Bollinger Bands use the standard deviation of closes around an SMA; Keltner Channels use the average true range around an EMA. Keltner lines are usually smoother and react less to a single large close.
What is a squeeze?
A squeeze is when the Bollinger Bands move inside the Keltner Channel: volatility is unusually low. The Squeeze Momentum indicator in Swiftedge Plus shows it directly.
Which settings can I change?
The EMA length, the ATR length, the ATR multiple and the color.
More in Classic indicators
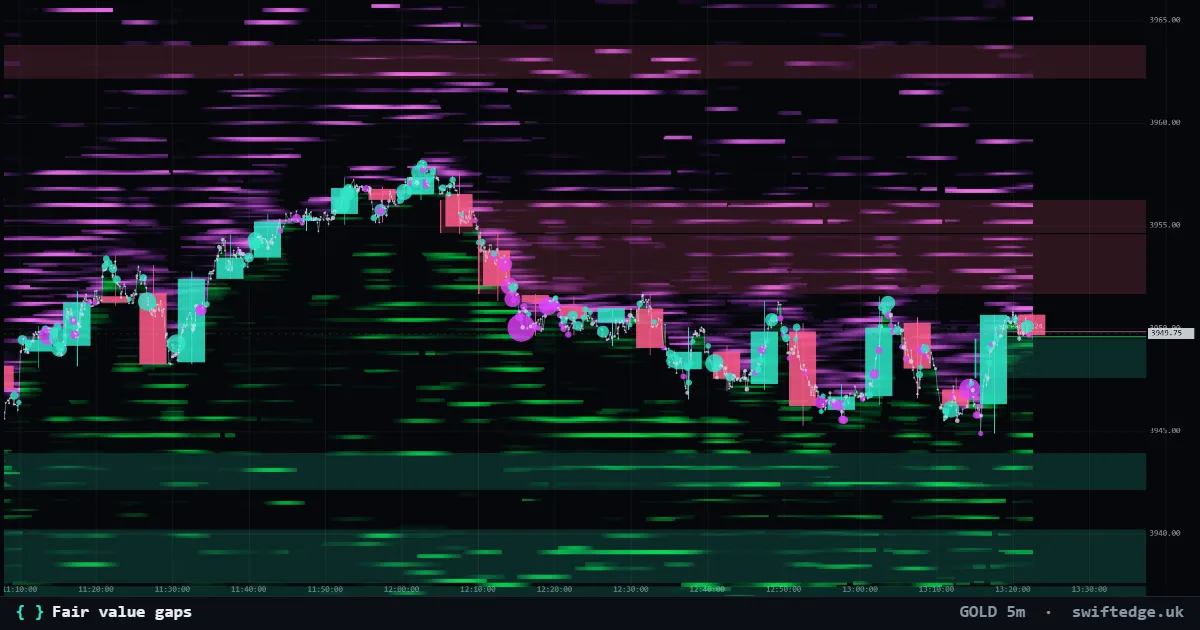
Three-candle gaps where price moved too fast to trade both ways; shown until price fills them.
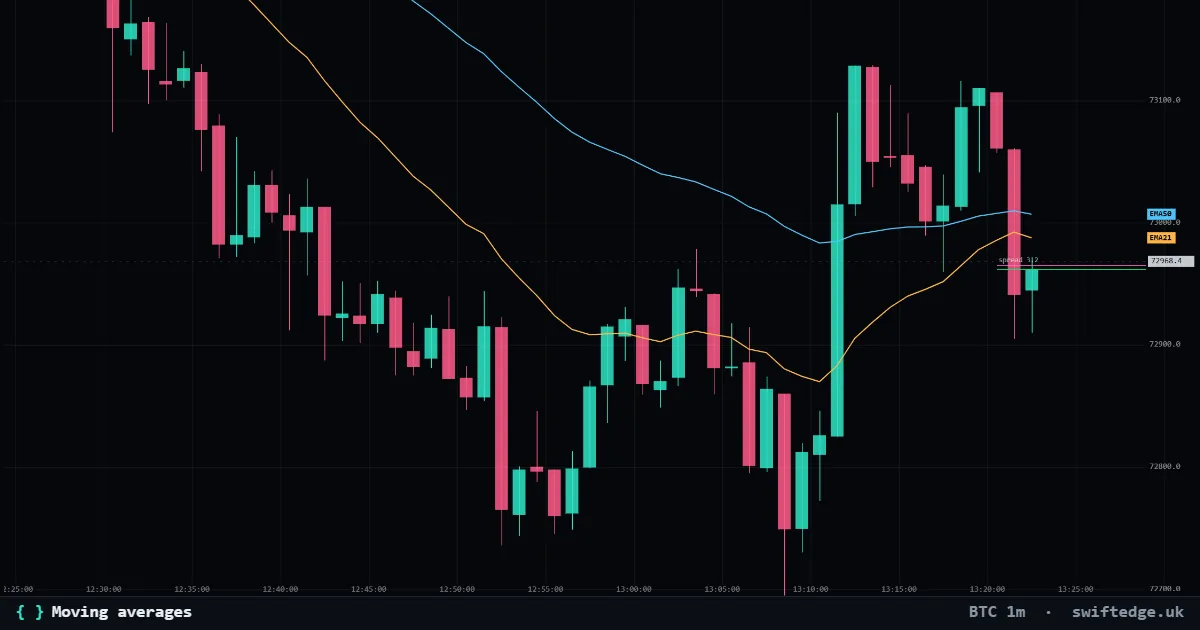
Up to three simple, exponential or weighted moving averages of the close.
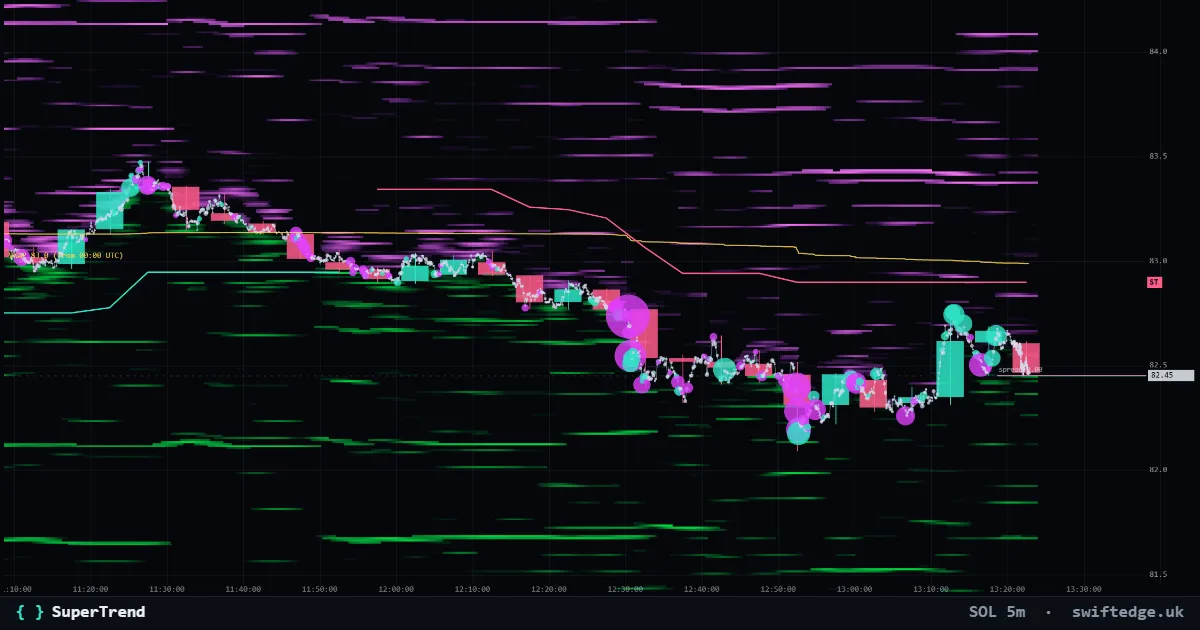
An ATR trailing line under price in uptrends and over price in downtrends; it flips when a candle closes through it.