Swiftedge Depth · Ethereum
Free live Ethereum footprint chart
A footprint chart shows how much ETH was bought and how much was sold at each price inside every candle. Swiftedge Depth draws one live for Ethereum, from every trade in the ETHUSDT futures book, on top of the order book heatmap. Free, in the browser, no sign-up.
Open the live Ethereum footprint.One-minute candles to start; change the timeframe in the top bar.
Ethereum footprint Bitcoin footprint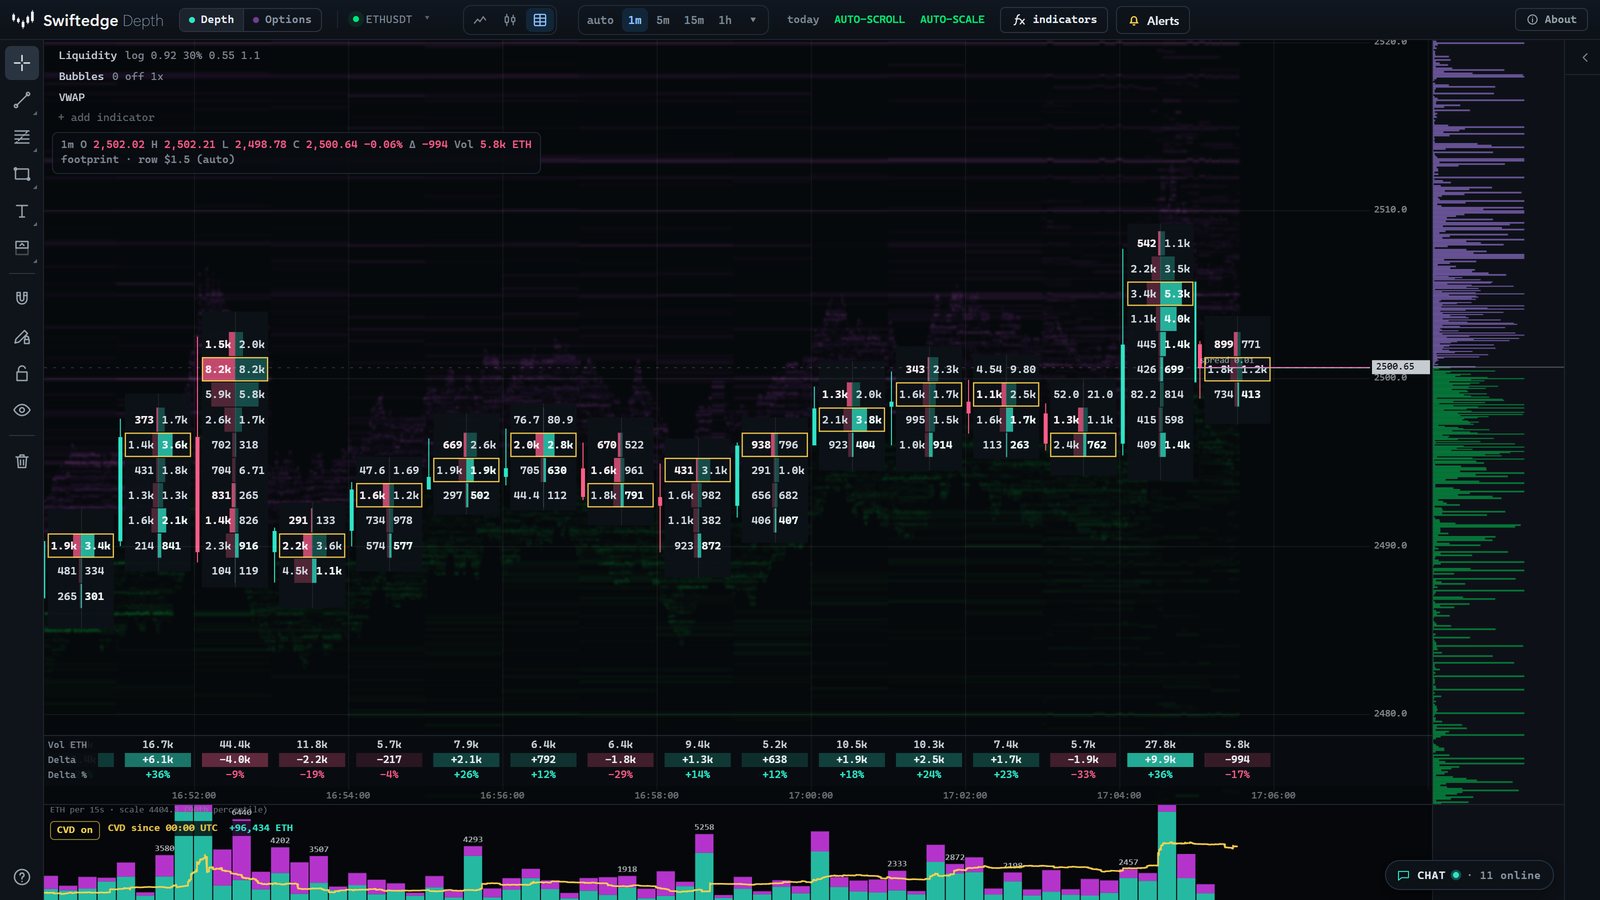
What it shows on Ethereum
Each candle is split into price rows. The left number in a row is ETH sold into the bid there, the right number ETH bought from the ask. A bar behind each number grows from the middle of the cell, so the heaviest prices stand out first. Under the chart, a table gives every candle's volume, delta (bought minus sold) and delta as a share of volume.
- Imbalances: buying at a price is compared with selling one row lower, diagonally. When one side is at least three times the other, the number is highlighted, teal for buyers and pink for sellers. Three or more in a row get a bar along the edge of the candle.
- Point of control: the row with the most ETH traded in each candle has a yellow frame.
- Zoom: zoom in for numbers, zoom out and each row becomes a coloured cell, zoom out further and you get ordinary candlesticks. Timeframes from 5 seconds to 1 hour, or automatic.
How to read it
The steps are the same as for Bitcoin, explained with examples on the footprint chart page: start with each candle's delta, find the point of control, look for imbalances and stacked imbalances, check the candle's edges for thin trading, and compare the numbers with the resting liquidity in the heatmap behind them. How long stacked imbalance zones have actually held is measured in the stacked imbalance guide.
Open ETH candles with imbalance zones
Everything else for Ethereum
- Ethereum order book heatmap: what the ETH heatmap shows and how to read it.
- Ethereum liquidation heatmap and ETH liquidations today.
- Ethereum options chain, ETH max pain and ETH levels today.
What it can't tell you
The footprint records trading that already happened on one venue, Binance's ETHUSDT perpetual. It leaves out spot markets and other exchanges and says nothing about where price goes next. It is a precise record of who traded where, not a signal.
Common questions
Is there a free Ethereum footprint chart?
Yes. Swiftedge Depth draws a live footprint chart for ETHUSDT in the browser, free and without an account. Open Ethereum Depth and pick the footprint icon in the top bar.
Where does the Ethereum data come from?
Every trade in the Binance ETHUSDT perpetual futures book, with the exchange's own aggressor side, so the split between buying and selling at each price is measured, not estimated. It is one venue, not the whole Ethereum market.
What row sizes does the ETH footprint use?
The row size follows the zoom, or you can fix it in the timeframe menu. For Ethereum the steps are scaled to the ETH price, from a few cents to a few dollars per row.
Does Ethereum have the same tools as Bitcoin?
Yes. Candlesticks, the footprint chart, stacked imbalance zones, the imbalance readout, liquidations, GEX and the rest of Depth work the same way on Ethereum.