Community scripts › Built into Depth › SuperTrend
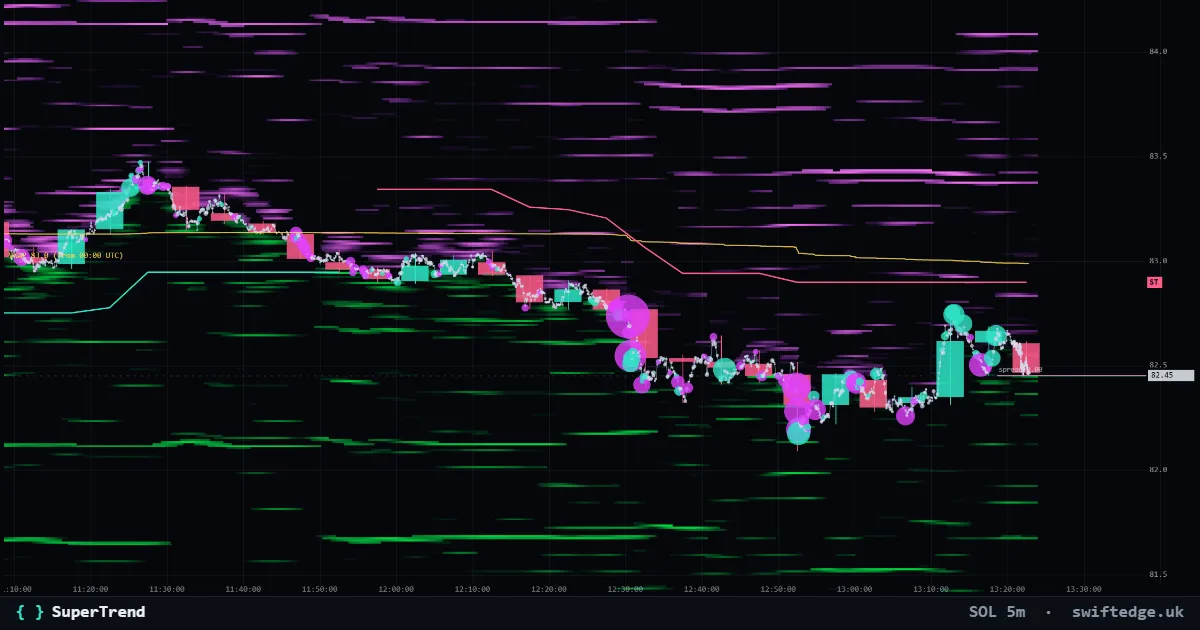
What it shows
An ATR trailing line under price in uptrends and over price in downtrends; it flips when a candle closes through it.
How to read it
The distance is a multiple of ATR, so it widens in volatile markets.
How it's calculated
SuperTrend starts from the middle of each candle (high plus low, divided by two) and adds or subtracts the average true range times a multiplier, by default ATR 10 (Wilder's method) times 3. While price stays on one side, the lower band can only rise and the upper band can only fall. When a candle closes through the active band, the line flips to the other side of price.
What it can't tell you
The line flips on closes only, so it always reacts after the move. In a range it can flip back and forth several times.
SuperTrend on 9 markets right now
| Market | Price | SuperTrend | Reading | |
|---|---|---|---|---|
| Bitcoin | 72,070 | 73,591 | Price below it (down side), 2.07 % away; on this side for 169 candles (7.0 days) | Open chart › |
| Gold | 3,899.33 | 3,963.82 | Price below it (down side), 1.63 % away; on this side for 54 candles (2.2 days) | Open chart › |
| Ethereum | 2,012 | 2,052 | Price below it (down side), 1.94 % away; on this side for 169 candles (7.0 days) | Open chart › |
| Solana | 81.47 | 83.53 | Price below it (down side), 2.47 % away; on this side for 169 candles (7.0 days) | Open chart › |
| XRP | 1.0303 | 1.0589 | Price below it (down side), 2.70 % away; on this side for 169 candles (7.0 days) | Open chart › |
| US 500 | 7,590.40 | 7,615.12 | Price below it (down side), 0.32 % away; on this side for 16 candles | Open chart › |
| US 100 | 28,241.2 | 28,340.9 | Price below it (down side), 0.35 % away; on this side for 17 candles | Open chart › |
| Silver | 50.451 | 51.661 | Price below it (down side), 2.34 % away; on this side for 23 candles | Open chart › |
| WTI crude oil | 85.39 | 85.97 | Price below it (down side), 0.68 % away; on this side for 15 candles | Open chart › |
Settings in Depth
| Timeframe | the chart's timeframe (or a fixed 1m to 1D) |
| ATR length | 10 |
| Multiplier | 3 |
FAQ
What does 'on this side for N candles' mean?
How many 1h candles have passed since SuperTrend last flipped on that market, counted on the candles we load (about 15 days).
Why is the line some distance away from price?
The distance is a multiple of the ATR, so it is wider in volatile markets and narrower in quiet ones.
What are the default settings?
ATR length 10 and multiplier 3 on the chart's timeframe. Both can be changed in Depth.
More in Classic indicators
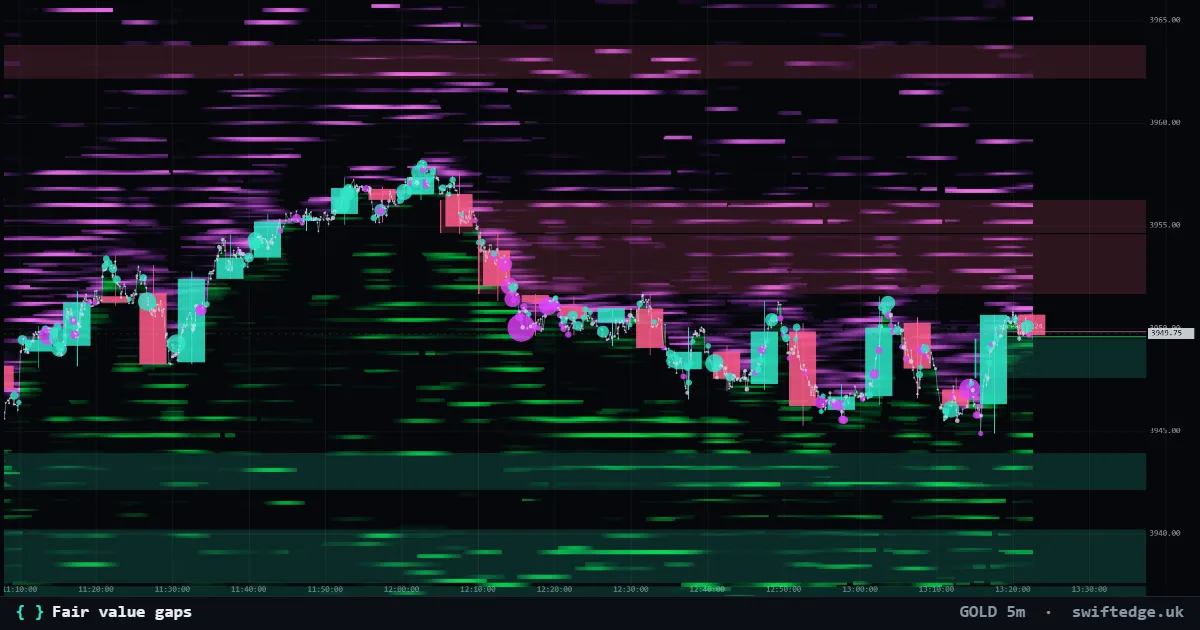
Three-candle gaps where price moved too fast to trade both ways; shown until price fills them.
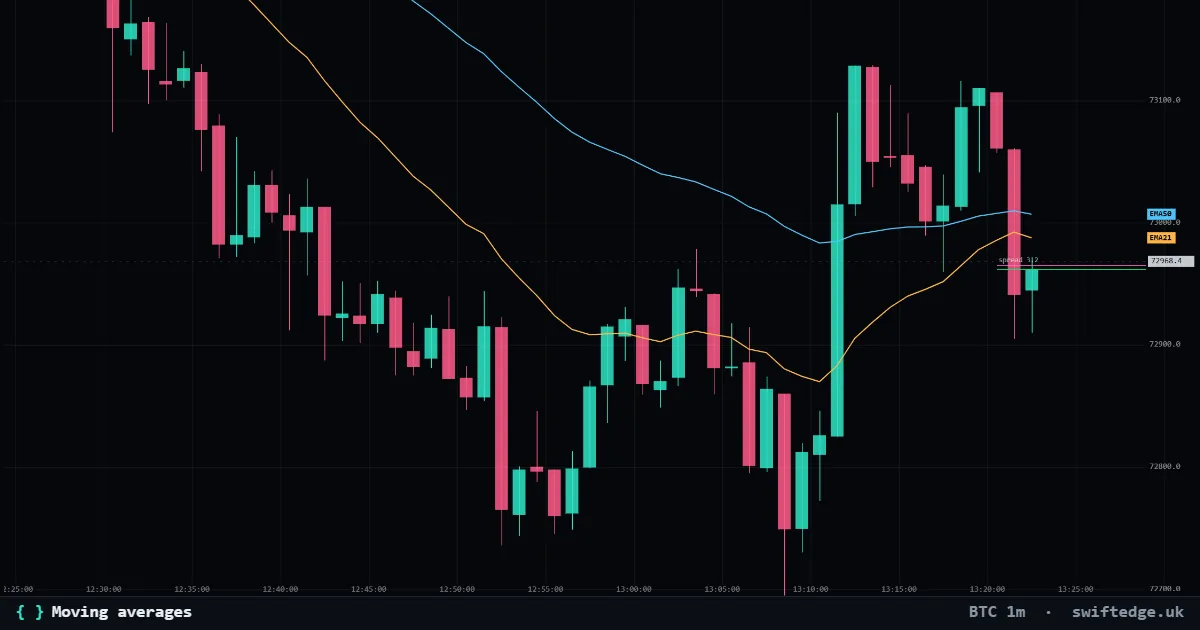
Up to three simple, exponential or weighted moving averages of the close.
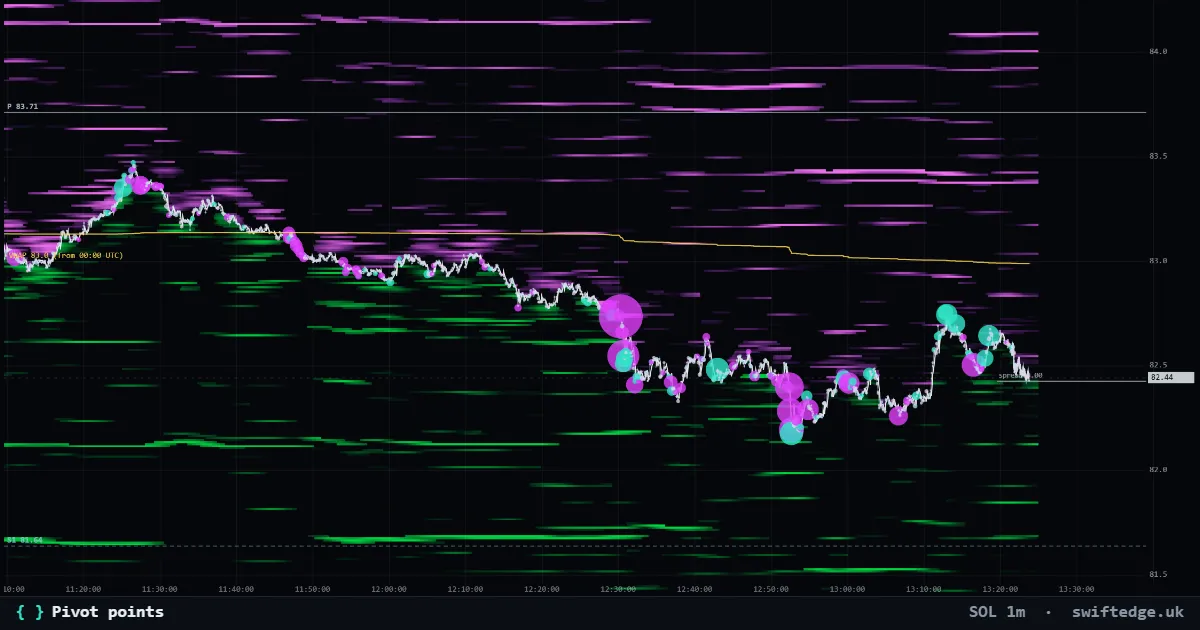
Classic, Fibonacci or Camarilla pivots from the previous day's or week's high, low and close.