Community scripts › Built into Depth › Bollinger Bands
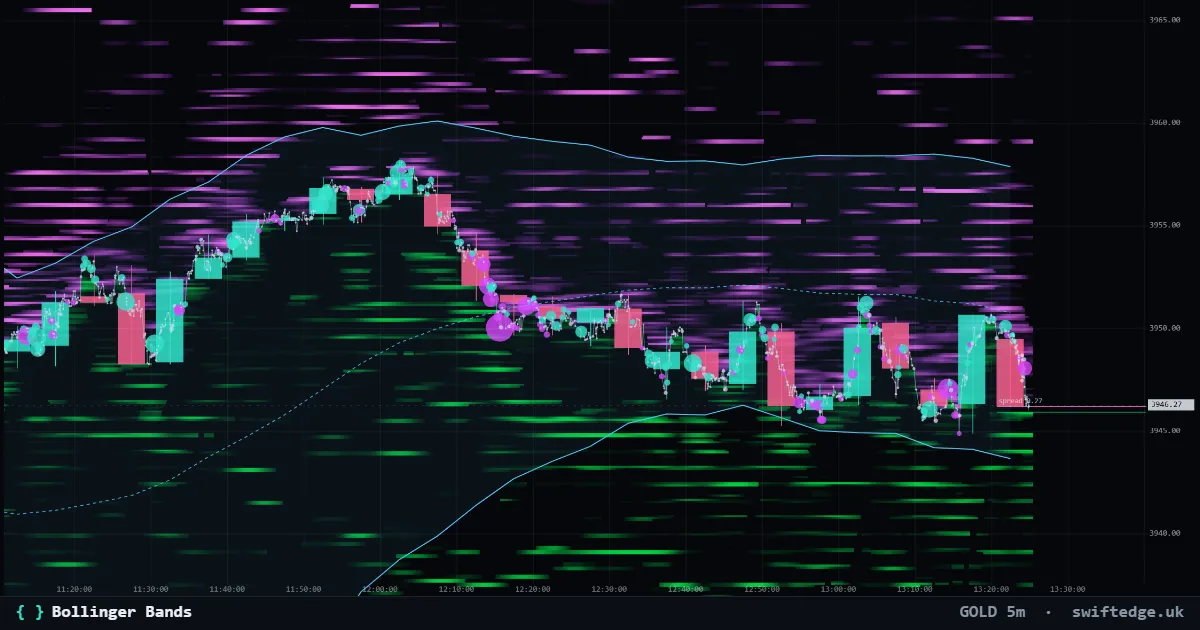
What it shows
A moving average with bands a number of standard deviations above and below.
How to read it
When the bands narrow, volatility is low; wide bands mean high volatility. Closes outside the bands are statistically unusual, not automatically reversals.
How it's calculated
The middle line is a 20-candle simple moving average of the close. The bands sit 2 standard deviations above and below it, with the standard deviation measured over the same 20 closes. When closes spread out, the bands widen; when they bunch up, the bands narrow.
What it can't tell you
A close outside a band only says the move was large compared with the last 20 candles. It does not say whether the move continues or reverses.
Bollinger Bands on 9 markets right now
| Market | Price | Upper / middle / lower | Reading | |
|---|---|---|---|---|
| Bitcoin | 72,070 | 74,806 / 73,585 / 72,364 | Price below the lower band; the bands are 3.32 % of price wide | Open chart › |
| Gold | 3,899.33 | 4,024.24 / 3,965.11 / 3,905.98 | Price below the lower band; the bands are 2.98 % of price wide | Open chart › |
| Ethereum | 2,012 | 2,085 / 2,048 / 2,011 | Price in the lower half of the bands (%B 0.02); the bands are 3.64 % of price wide | Open chart › |
| Solana | 81.47 | 84.93 / 83.12 / 81.32 | Price in the lower half of the bands (%B 0.04); the bands are 4.34 % of price wide | Open chart › |
| XRP | 1.0303 | 1.0655 / 1.0474 / 1.0293 | Price in the lower half of the bands (%B 0.03); the bands are 3.45 % of price wide | Open chart › |
| US 500 | 7,590.40 | 7,616.87 / 7,589.90 / 7,562.93 | Price in the upper half of the bands (%B 0.51); the bands are 0.71 % of price wide | Open chart › |
| US 100 | 28,241.2 | 28,376.3 / 28,161.7 / 27,947.1 | Price in the upper half of the bands (%B 0.69); the bands are 1.52 % of price wide | Open chart › |
| Silver | 50.451 | 52.217 / 51.340 / 50.463 | Price below the lower band; the bands are 3.42 % of price wide | Open chart › |
| WTI crude oil | 85.39 | 86.02 / 85.14 / 84.27 | Price in the upper half of the bands (%B 0.64); the bands are 2.05 % of price wide | Open chart › |
Settings in Depth
| Timeframe | the chart's timeframe (or a fixed 1m to 1D) |
| Length | 20 |
| Standard deviations | 2 |
FAQ
What does %B mean in the table?
%B is where price sits between the bands: 0 at the lower band, 1 at the upper band and 0.5 at the middle line. Above 1 or below 0 means price is outside the bands.
What does the band width tell me?
How spread out the last 20 closes were, shown as a percentage of price. Very narrow bands mark a quiet market; they say nothing about which way it breaks.
Can I change the settings?
Yes: the length (2 to 200 candles), the number of standard deviations (0.5 to 4), the color and the fill.
More in Classic indicators
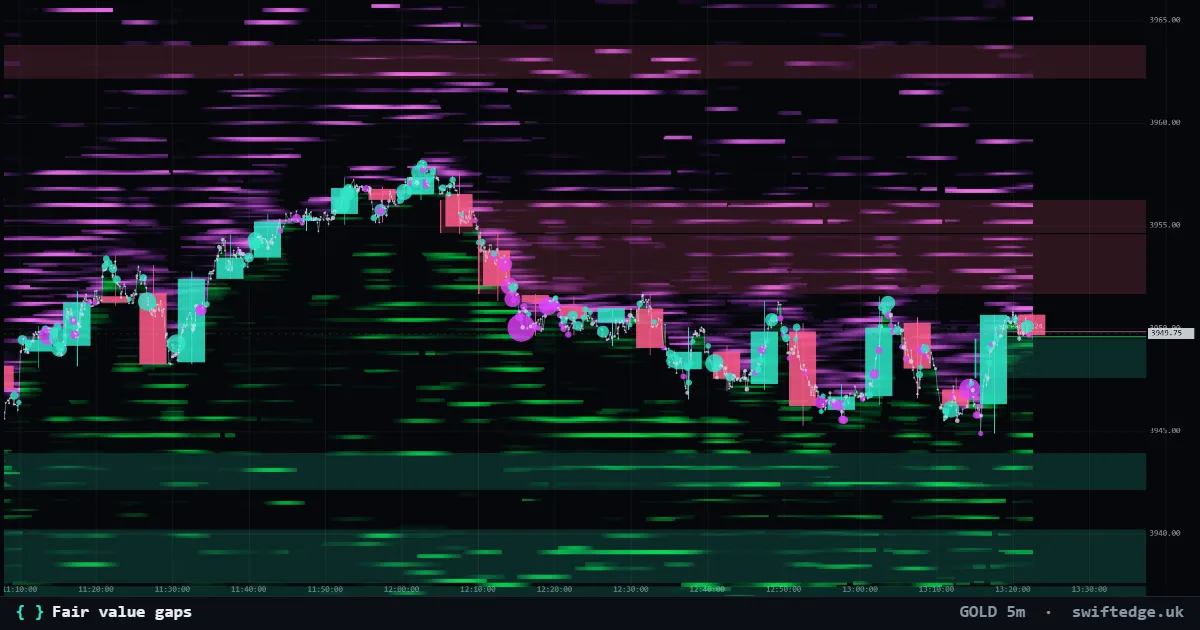
Three-candle gaps where price moved too fast to trade both ways; shown until price fills them.
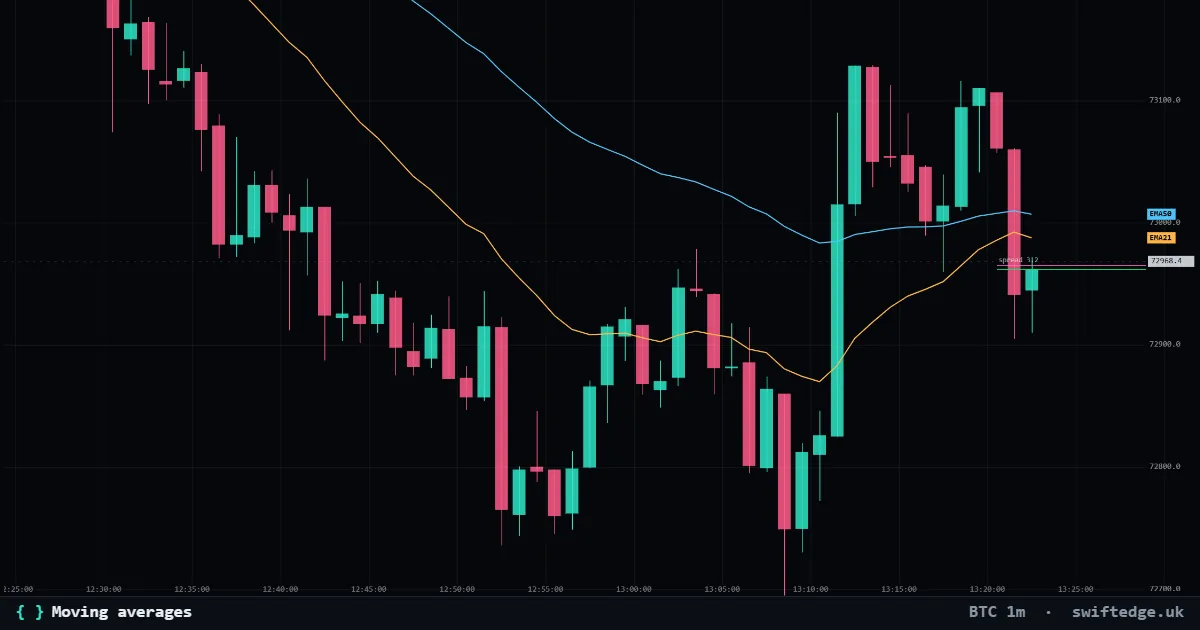
Up to three simple, exponential or weighted moving averages of the close.
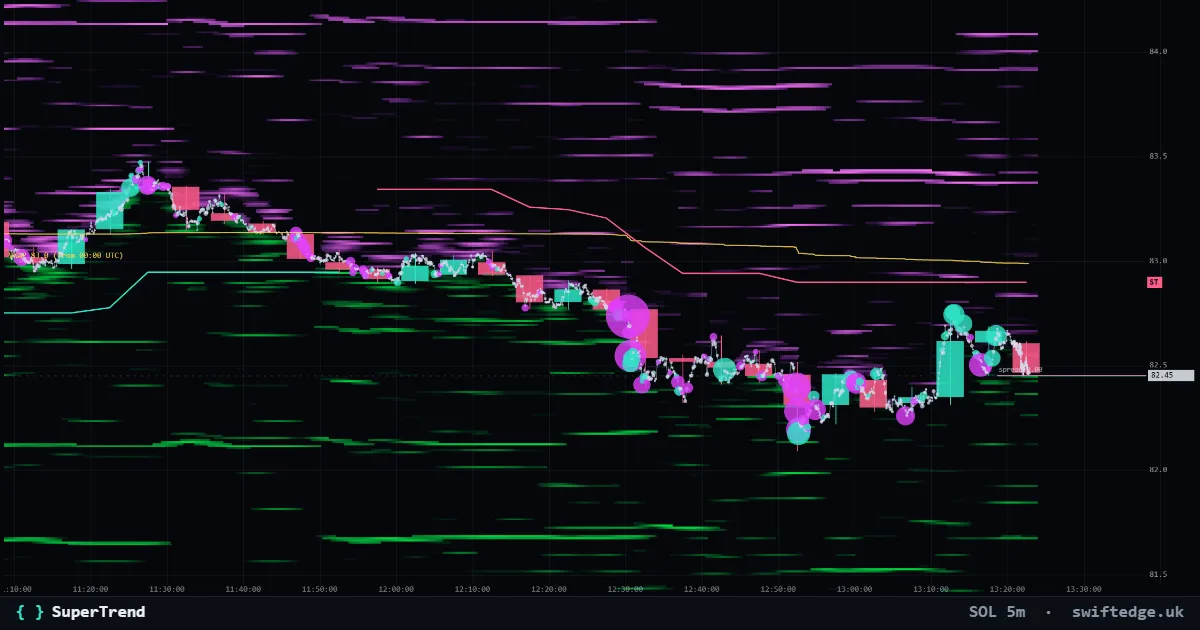
An ATR trailing line under price in uptrends and over price in downtrends; it flips when a candle closes through it.