Community scripts › Built into Depth › SMT
What it shows
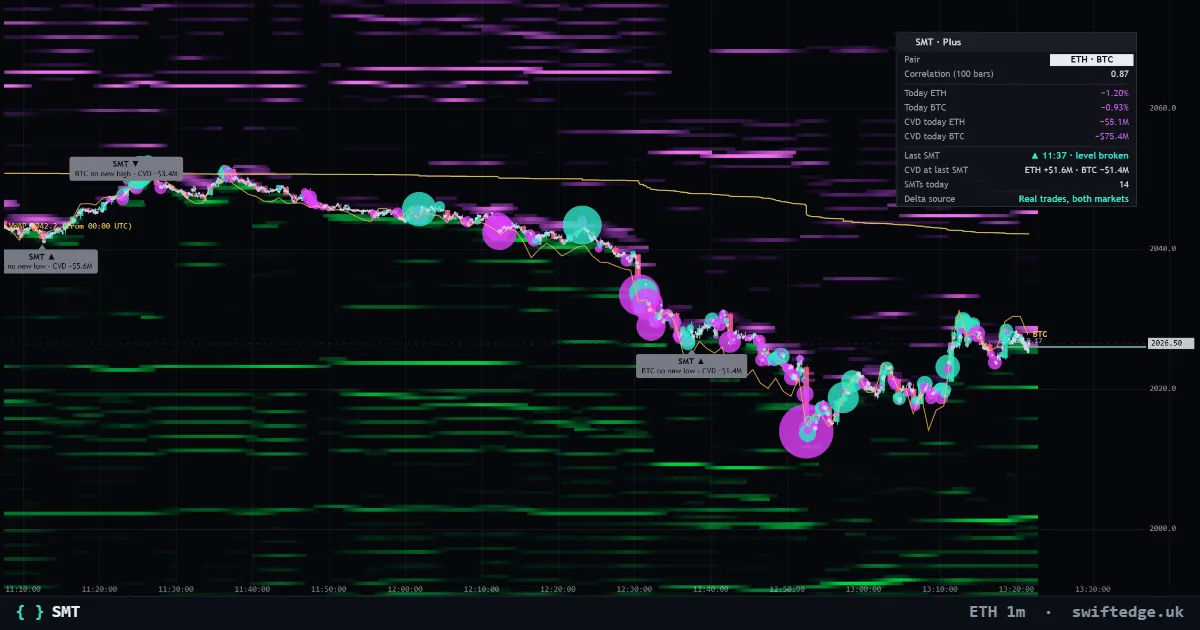
Smart money divergence against the correlated market (Bitcoin and Ethereum, gold and silver, US 500 and US 100), with the correlated market drawn on the chart and the real CVD of both at every divergence.
How to read it
A divergence is marked when one market makes a new high or low over the last 20 candles and the correlated market does not, for example Bitcoin against Ethereum or gold against silver. The correlated market is drawn on the chart, with the real CVD of both at every divergence.
What it can't tell you
Correlated markets diverge often for ordinary reasons. A divergence is context, not timing.
Settings in Depth
| Divergence | |
|---|---|
| Swing window | 20 bars |
| SMT marks | on |
| Gray out an SMT when its level breaks | on |
| Correlated market | |
| Draw the correlated market on the chart | on |
| Real data | |
| Real CVD of both markets at every SMT | on |
FAQ
Which pairs are compared?
Bitcoin and Ethereum, gold and silver, US 500 and US 100.
What is a smart money divergence?
One market makes a new high or low while its correlated market does not.
Can I change the swing window?
Yes: 10, 20 or 40 bars.
More in Swiftedge Plus
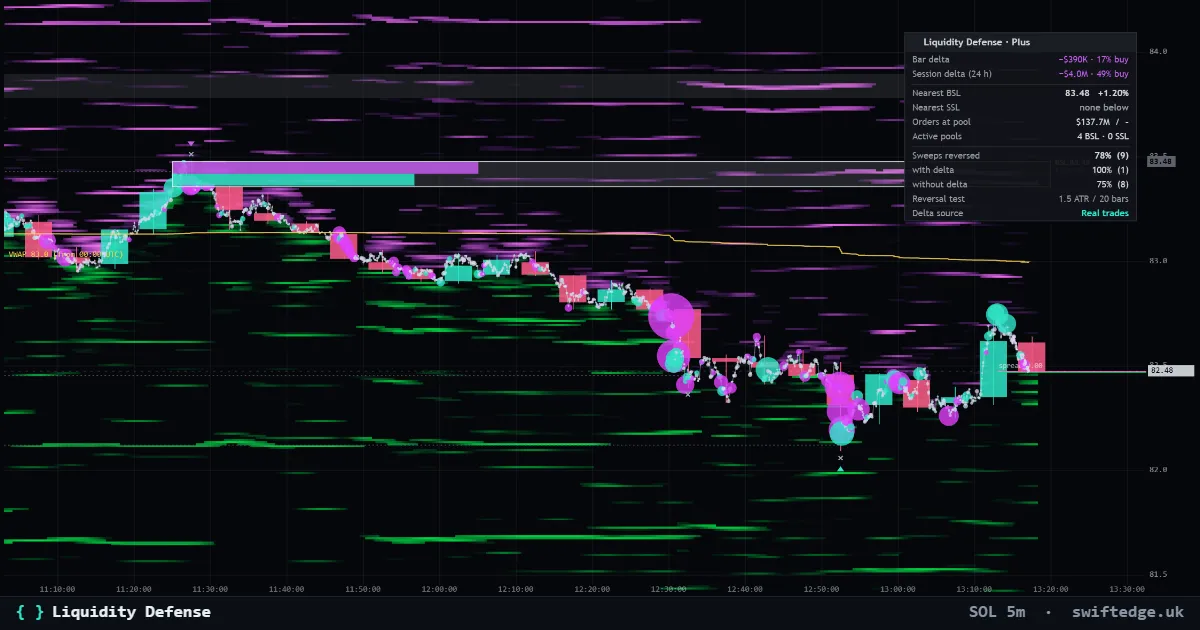
Buy-side and sell-side pools above highs and below lows with formation, defense profile and sweeps, from real trades, with the orders and liquidations at the nearest pools.
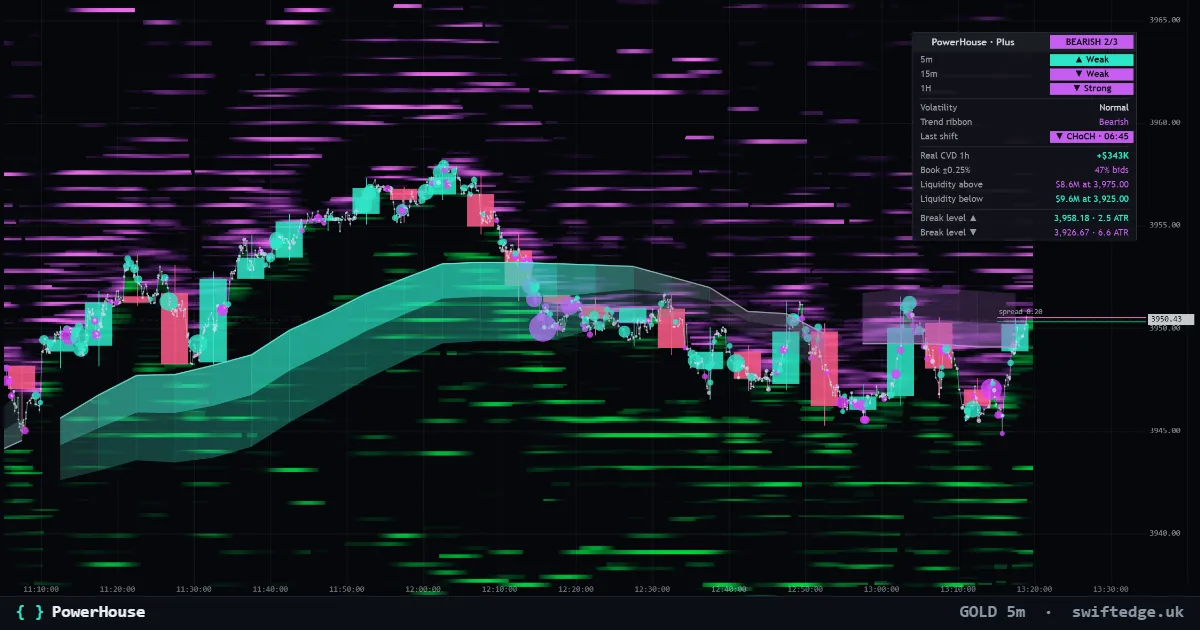
The adaptive trend ribbon, structure shifts (CHoCH and BOS) and a Trend Matrix, with the real walls and liquidation clusters above and below price.
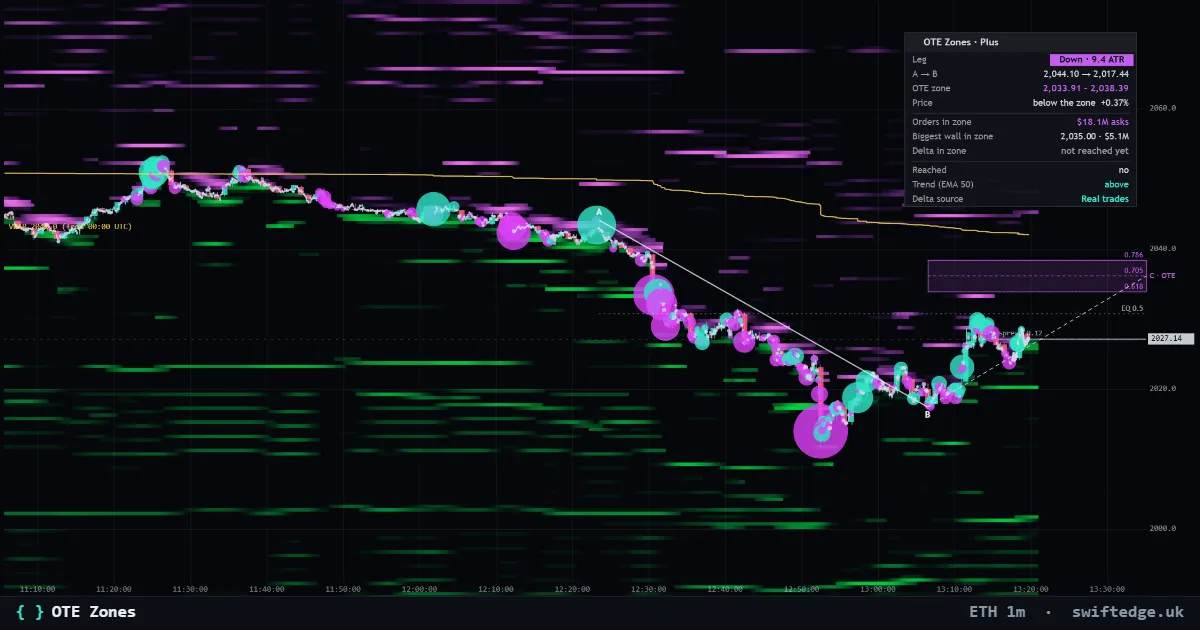
The latest impulse leg A to B and its optimal trade entry zone (0.618 to 0.786), with the real orders and liquidations inside the zone and who traded when price was in it.