Community scripts › Built into Depth › Levels around price
Levels around price
What it shows
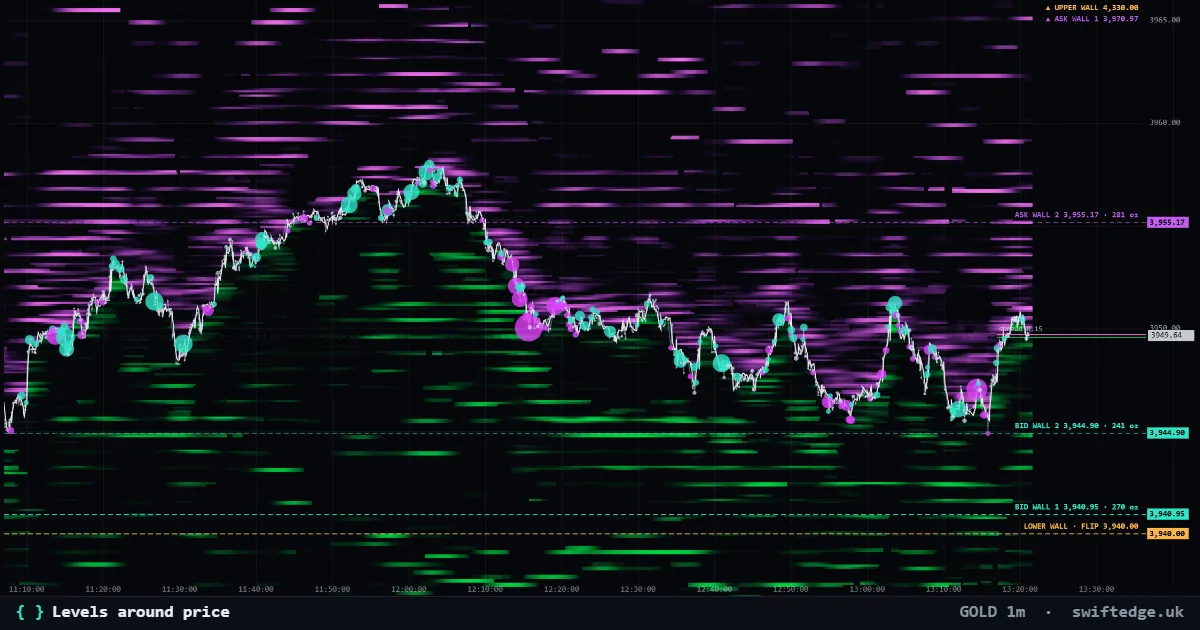
The biggest bid and ask walls near the price and the Positioning levels (upper wall, lower wall, flip, max liquidation) as lines with name and price. Pick which levels to show in the settings.
How to read it
The same levels as the 'Levels around price' card on the home page, drawn on the chart. Walls are the largest resting orders in the live order book, by default the three biggest on each side between the lower and upper wall (at most 3 % from price); wall 1 is the biggest and drawn strongest. The Positioning levels update every 30 seconds. Levels outside the visible price range show as a small arrow at the edge. Also in the Terminal's chart indicators, with the same settings.
How it's calculated
The layer draws the biggest bid and ask walls near the price and the Positioning levels (upper wall, lower wall, flip and, optionally, max liquidation) as lines with a name and price. By default it shows the three biggest walls on each side between the lower and upper wall, at most 3 % from price; wall 1 is the biggest and drawn strongest.
What it can't tell you
Walls can be canceled, and Positioning is an estimate that updates every 30 seconds.
Levels around price on 9 markets right now
| Market | Price | Nearest levels | Reading | |
|---|---|---|---|---|
| Bitcoin | 72,060 | ↑ 72,100 bid wall $18.5M · ↓ 72,000 positioning lower wall | Nearest level 0.06 % away (above) | Open chart › |
| Gold | 3,897.15 | ↑ 3,904.00 ask wall $1.7M · ↓ 3,894.00 bid wall $1.7M | Nearest level 0.08 % away (below) | Open chart › |
| Ethereum | 2,011 | ↑ 2,012 bid wall $10.1M · ↓ 2,010 positioning flip | Nearest level 0.05 % away (above) | Open chart › |
| Solana | 81.45 | ↑ 81.70 ask wall $5.4M · ↓ 81.30 bid wall $6.4M | Nearest level 0.18 % away (below) | Open chart › |
| XRP | 1.0304 | ↑ 1.0330 ask wall $3.1M · ↓ 1.0300 positioning flip | Nearest level 0.04 % away (below) | Open chart › |
| US 500 | 7,592.33 | ↑ 7,600.00 ask wall $3.8M · ↓ 7,590.00 bid wall $4.1M | Nearest level 0.03 % away (below) | Open chart › |
| US 100 | 28,250.7 | ↑ 28,260.0 ask wall $4.5M · ↓ 28,220.0 bid wall $3.8M | Nearest level 0.03 % away (above) | Open chart › |
| Silver | 50.429 | ↑ 50.480 bid wall $2.1M · ↓ 50.400 bid wall $2.5M | Nearest level 0.06 % away (below) | Open chart › |
| WTI crude oil | 85.38 | ↑ 85.50 ask wall $1.3M · ↓ 85.30 bid wall $1.6M | Nearest level 0.09 % away (below) | Open chart › |
Settings in Depth
| Levels | |
|---|---|
| Ask walls (biggest resting sell orders near price) | on |
| Bid walls (biggest resting buy orders near price) | on |
| Upper wall (Positioning) | on |
| Lower wall (Positioning) | on |
| Flip (Positioning) | on |
| Max liquidation (Positioning) | off |
| Walls | |
| Walls per side (biggest first) | 3 |
| Look for walls | between the lower and upper wall |
FAQ
Which levels are shown by default?
Ask walls, bid walls, the upper and lower wall and the flip. Max liquidation can be switched on.
Why do some markets show only walls?
Positioning levels exist only where we have position data; walls come from the order book on every market.
How far from price does it look for walls?
By default between the lower and upper wall, at most 3 % from price.
More in Liquidations & positioning
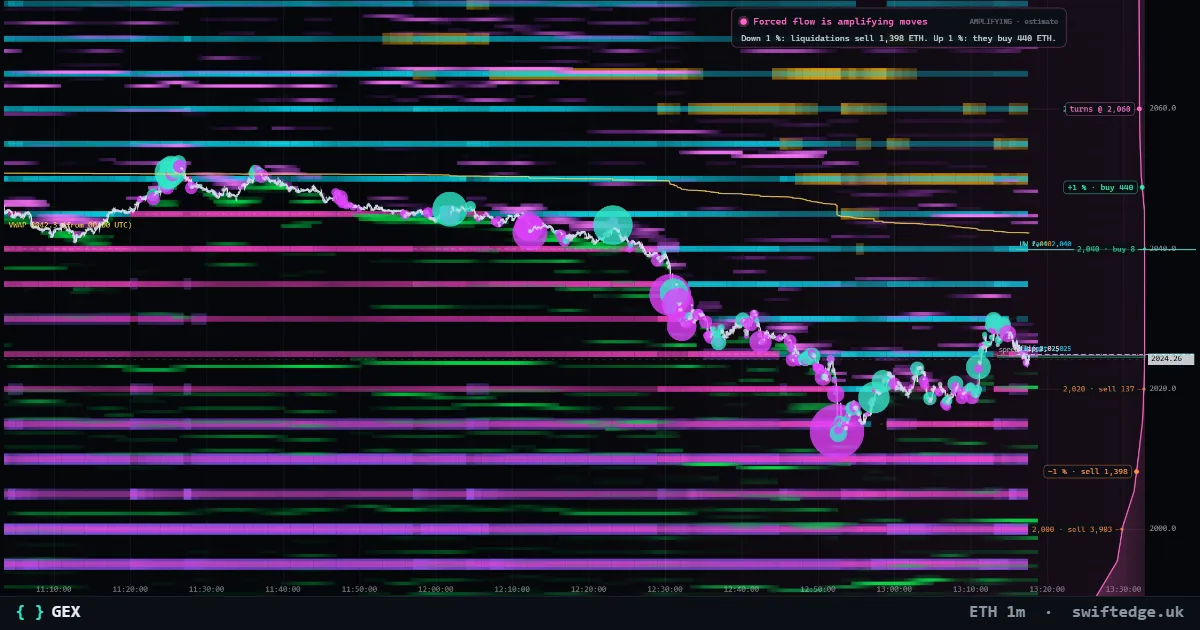
GEX for Bitcoin, Ethereum and Solana, the options gamma by price with the gamma flip, call wall and put wall, computed in your browser from public options data. Gold: where leveraged positions would be liquidated (Swiftedge Positioning).
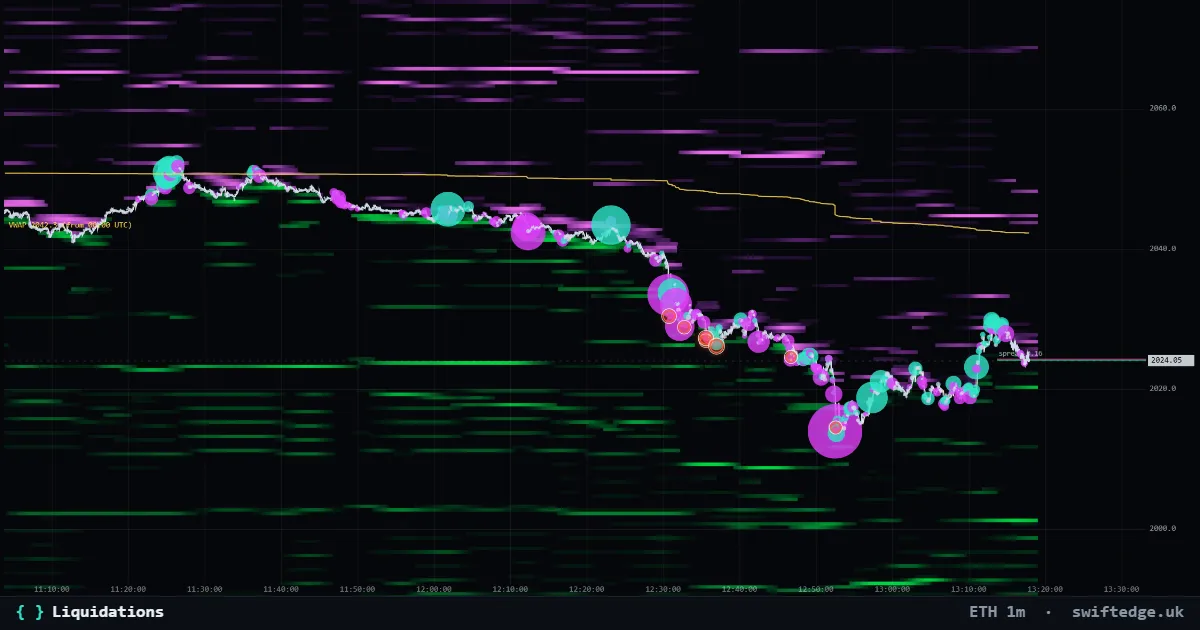
Real forced closes in perpetual futures: orange when a long was liquidated, cyan when a short was; size by dollar value.