₿BitcoinAuGoldΞEthereum◎SolanaXXRP500US 500100US 100AgSilverCLWTI
TodayDaily archiveWeekly
Daily market structure US500 perpetualUpdating hourly

US 500 on Friday, 30 October 2026

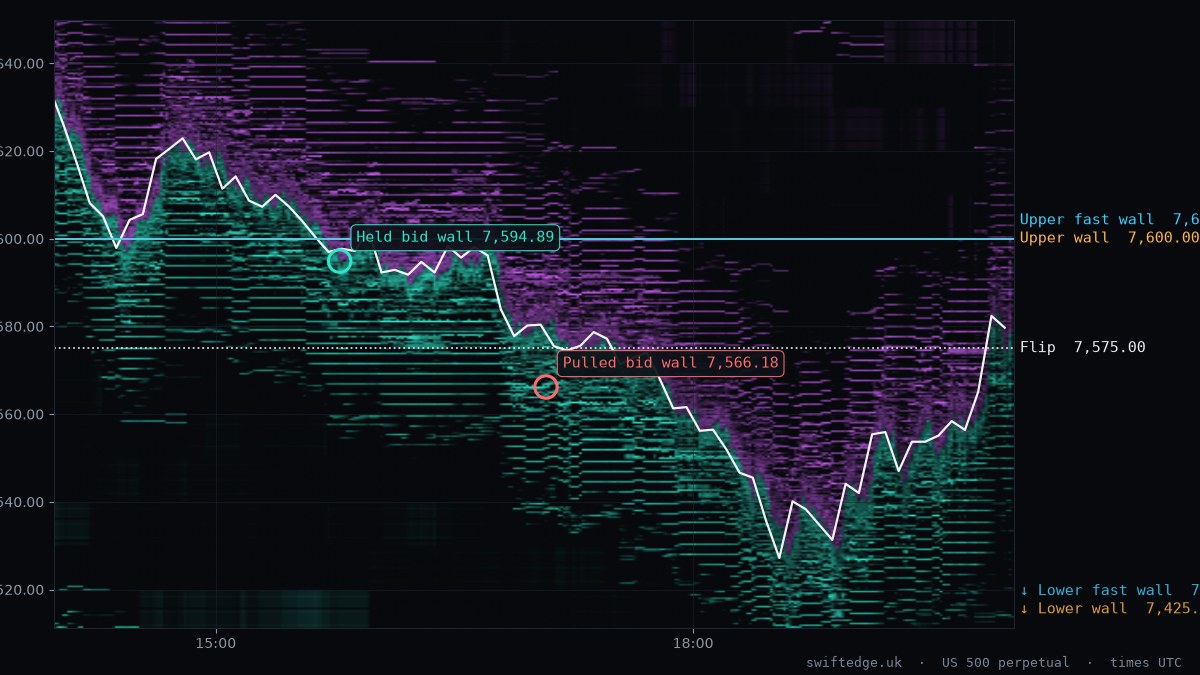
New York session: US500 fell 0.71 % (range 7,526.00–7,635.10); the bid wall at 7,566.18 was pulled at 1:04 PM ET (17:04 UTC). US500 is down 1.13 % so far today, trading between 7,526.00 and 7,671.80. The high came at 8:00 PM ET (00:00 UTC) and the low at 2:35 PM ET (18:35 UTC).

LIVE · US500 perpetual
7,582.30
▼ -1.13 % today
Low 7,526.00High 7,671.80
bid wall 7,420.00ask wall 7,730.00
– – open 7,669.20
00:0006:0012:0018:0024:00 UTC
Funding / 8 h+0.0050 %
longs pay · +5.5 % a year
Open interest47,801 US500– in 24 h · $362.5M

US 500 right now

Updated 30 Oct 2026, 4:25 PM ET (20:25 UTC) · refreshed every 5 minutes

Levels around the price

±3.5 % around price · live, refreshed every 5 minutes

7,4007,5007,6007,7007,8007,420.00 · 1,323 units7,580.00 · 776 units7,730.00 · 1,392 units7,585.00 · 666 units7,610.00 · 390 unitsUpper wall 7,600.00 (+0.2 %)Upper fast wall 7,600.00 (+0.2 %)Flip 7,575.00 (-0.1 %)Lower fast wall 7,550.00 (-0.4 %)↓ Lower wall 6,850.00 (-9.7 %)7,583.70
7,4007,5007,6007,7007,8007,420.00 · 1,3237,580.00 · 7767,730.00 · 1,3927,585.00 · 6667,610.00 · 390UW 7,600.00UW fast 7,600.00Flip 7,575.00LW fast 7,550.00↓ LW 6,850.00 (-9.7 %)7,583.70
bid wallsask wallsUpper wallLower wallFlipUpper fast wallLower fast wall

The day on one line

Asia-0.31 %London-0.15 %New York-0.71 %Held bid 7,594.89Pulled bid 7,566.18NOW 20:0800:0003:0006:0009:0012:0015:0018:0021:0024:00
Asia-0.31 %London-0.15 %New York-0.71 %Held bid 7,594.89Pulled bid 7,566.18NOW 20:0800:0006:0012:0018:0024:00

Sessions

Asia, London and New York, each summed up when it closes. Times follow local opening hours.

Asia
8:00 PM–4:00 AM ET (00:00–08:00 UTC)
Closed
−0.31 %
7,629.30 – 7,671.80  ·  range 42.50
high 8:00 PM ET (00:00 UTC)  ·  low 9:45 PM ET (01:45 UTC)  ·  10,587 US500
No clean wall event in this session.
London
4:00–9:30 AM ET (08:00–13:30 UTC)
Closed
−0.15 %
7,628.90 – 7,660.10  ·  range 31.20
high 5:00 AM ET (09:00 UTC)  ·  low 7:50 AM ET (11:50 UTC)  ·  4,952 US500
No clean wall event in this session.
New York
9:30 AM–4:00 PM ET (13:30–20:00 UTC)
Closed
−0.71 %
7,526.00 – 7,635.10  ·  range 109.10
high 9:55 AM ET (13:55 UTC)  ·  low 2:35 PM ET (18:35 UTC)  ·  36,124 US500
Upper wall 7,600.00  ·  Lower wall 7,425.00
US500 order book heatmap, New York session, 30 Oct 2026
US500 order book heatmap for 30 Oct 2026 with price, positioning walls and the day's liquidity wall events
Asks (resting sell liquidity)Bids (resting buy liquidity) Upper / lower wallFast wallsFlip

What happened

Written from the data, not opinion.

Positioning puts the upper wall at 7,600.00 and the lower wall at 7,425.00.

The bid wall at 7,594.89 held at 11:46 AM ET (15:46 UTC): about 422 US500 traded into it and price turned 5.95 USD away.

At 1:04 PM ET (17:04 UTC) a 440 US500 bid wall at 7,566.18 was pulled before price reached it.

Liquidity wall events

Classified from every trade at the wall's own price, not from candles. What is a liquidity wall?

EventWallTime
HeldBid wall 7,594.89
422 US500 traded into it, price turned 5.95 USD
Open in Depth →
11:46 AM ET (15:46 UTC)
PulledBid wall 7,566.18
440 US500 wall, 431 US500 removed in 109.0 s, almost nothing traded
Open in Depth →
1:04 PM ET (17:04 UTC)

Positioning

Where public open positions would be liquidated, by price: the upper wall, lower wall, flip and fast walls (20x leverage or more). It is an estimate from part of the market's positions. Latest snapshot.

Upper wall
Largest cluster of liquidations above the price
7,600.00 from 7,650.00
Lower wall
Largest cluster of liquidations below the price
7,425.00 from 7,500.00
Flip
Where liquidations below equal liquidations above
7,575.00 from 7,625.00
Upper fast wall
Positions with 20x leverage or more
7,600.00 from 7,650.00
Lower fast wall
Positions with 20x leverage or more
7,425.00 from 7,500.00

Resting liquidity at 4:07 PM ET (20:07 UTC)

Largest walls within 2.5 % of price.

Largest bids below

  • 7,420.001,279 US500
  • 7,567.50285 US500
  • 7,582.50255 US500

Largest asks above

  • 7,730.001,271 US500
  • 7,585.00275 US500
  • 7,597.50274 US500

See every wall form and disappear, live.The same data as this report, second by second, free in your browser.

Open Depth

Also in Português · Español

Method. Price, volume and order book from perpetual futures. Positioning shows where public open positions would be liquidated, by price; it is an estimate from part of the market's positions. A wall is "held" when trades hit it and price turned, "pulled" when it vanished within seconds with almost nothing traded, "eaten" when most of it was traded away. Times are New York time (ET), with UTC in brackets. Updated 30 Oct 4:07 PM ET (20:07 UTC).