Guide
Spoofing in Bitcoin: how often big walls are pulled
Anyone who watches a Bitcoin order book heatmap sees it: a thick wall sits there for minutes, price comes closer, and the wall is gone. Was it spoofing? This guide explains what spoofing is, why not every pulled order is spoofing, and what happened to every large wall in four weeks of Swiftedge's own order book recordings.
What spoofing is, and what it is not
Spoofing is placing large orders with no intention of letting them trade, to make supply or demand look different than it is, then cancelling them before they fill. A thick bid under price can make sellers hesitate; a thick ask above can make buyers wait.
A cancelled order is not proof of spoofing. Market makers quote on both sides and move their orders constantly as price, risk and volatility change. Large traders split and re-place orders. What the order book can show is what happened: whether a wall traded or was pulled. It cannot show why.
How we classified the walls
We used the same method as the daily BTC report, on Swiftedge's own recording of the Binance BTCUSDT perpetual: the order book four times a second and every single trade.
- Large walls: 25-USD price levels in the top 3 % of resting size that day, standing for at least six minutes.
- When they disappeared: the moment their size fell below 30 % of what it had been and stayed there.
- Why they disappeared, judged only from trades at the wall's own price:
- Eaten: at least half of the size that disappeared was traded.
- Pulled: at most 10 % traded, the wall was at least 3 USD from price, and at most 10 % had traded over its whole life.
- Held: price came to the wall, at least 5 BTC traded into it, most of it was still there afterwards, and price turned at least 60 USD away.
Anything in between is "mixed", and cases where the size faded gradually or the data around the moment was incomplete are left out. Of 801 large walls that ended while price was within 0.4 %, 244 could be classified this cleanly.
One example
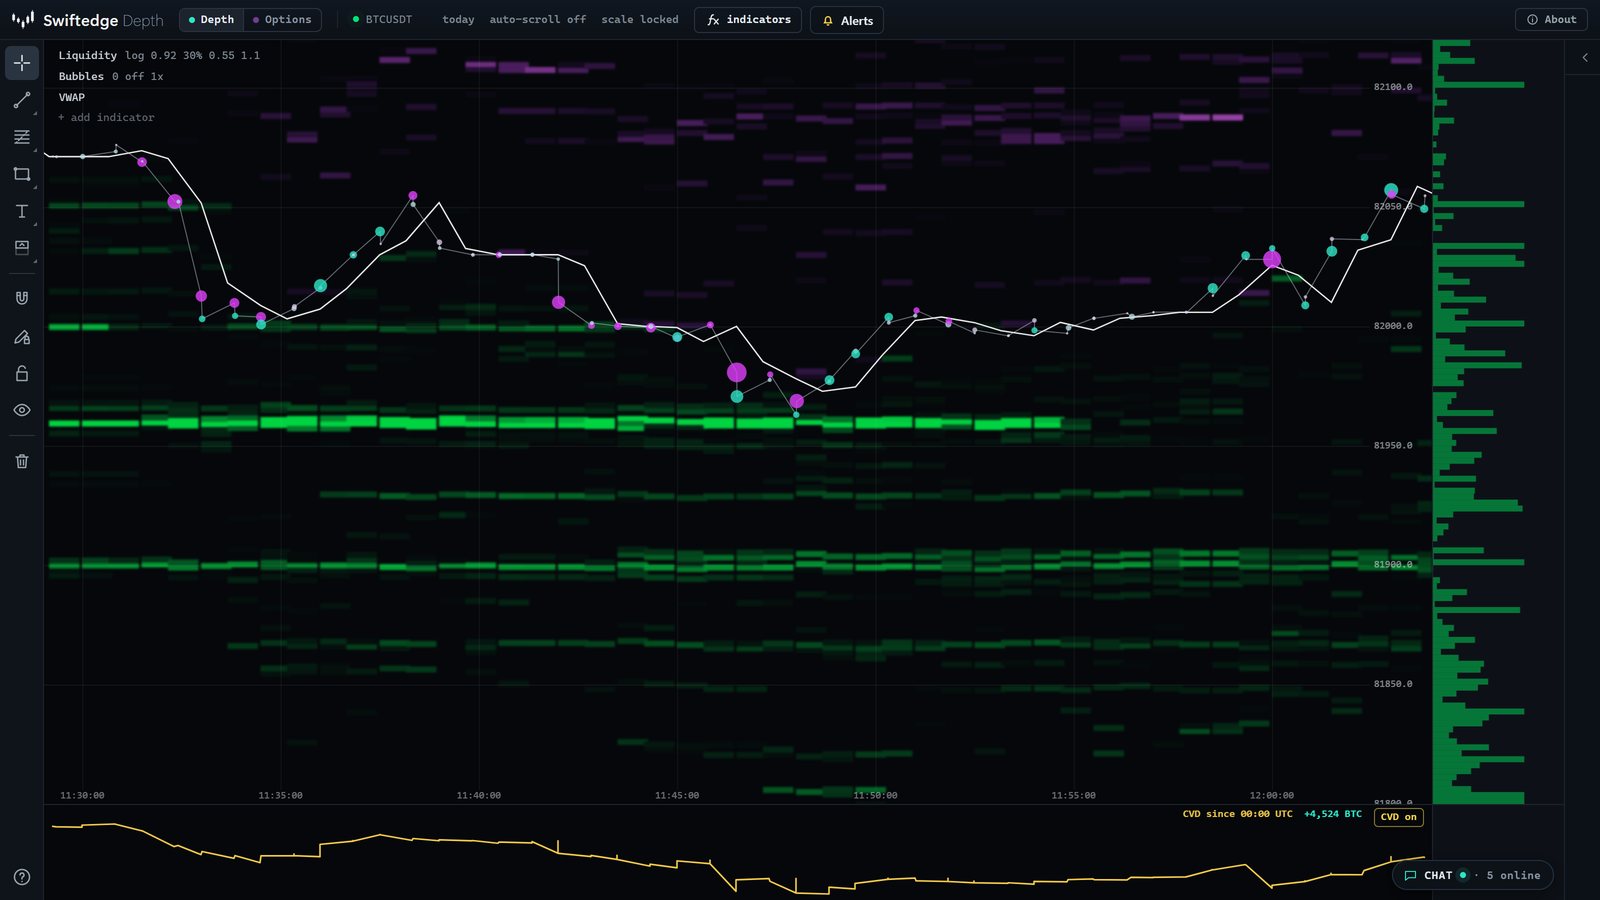
On 18 October 2026 a bid wall of about 416 BTC, roughly 34 million dollars, sat at 81,960, about 34 USD under price. It had stood for half an hour. At 11:54:02 UTC it was gone in 0.3 seconds. In its whole life only 7 BTC had traded at that price.
What four weeks show
| How the wall ended | Walls | Median size | Median distance from price | Median time to disappear |
|---|---|---|---|---|
| Pulled: cancelled, almost nothing traded at its price | 116 (48 %) | 123 BTC | 151 USD | 0.3 s |
| Eaten: at least half of it traded away | 99 (41 %) | 127 BTC | 3 USD | 0.4 s |
| Mixed: some traded, some cancelled | 29 (12 %) | – | – | – |
- About half of the large walls that disappeared near price were pulled, not traded: 116 of 244.
- Pulled walls go fast. The median one vanished in 0.3 seconds, 71 % within one second, and the median one lost 97 % of its size in that moment. In at least nine of ten cases not a single BTC had traded at the wall's price during its life.
- They had stood a while. Median 13 minutes (half between 7 and 23 minutes) before they were cancelled.
- Both sides. 55 pulled walls were bids and 61 were asks.
- Size did not decide it. Between 41 % and 58 % were pulled in each size group (under 100, 100 to 200 and over 200 BTC), with no steady pattern.
Distance decides almost everything
| Distance from price when the wall disappeared | Walls | Pulled | Eaten |
|---|---|---|---|
| Under 25 USD | 61 | 20 % | 75 % |
| 25 to 75 USD | 37 | 62 % | 27 % |
| 75 to 150 USD | 25 | 88 % | 0 % |
| Over 150 USD | 63 | 94 % | 3 % |
Walls that were still there when price reached them mostly traded. Walls that disappeared further away were almost always cancelled: 92 % of those more than 75 USD from price. In other words, a large wall far from price told us little about whether there would be size at that price once price got there.
Clean "holds" were rare. Of 172 walls that price came within 37.5 USD of, 9 met all the conditions for a hold (median 50 BTC traded into them, price turned a median 118 USD away). Many more were partly traded and partly cancelled.
How to use this when reading a heatmap
- Treat distant walls as context, not commitments. They show where someone is willing to be seen, for now.
- Watch the contact. Whether a wall holds, is eaten or is pulled is decided when price gets there. In Swiftedge Depth an eaten wall dims under a stack of bubbles; a pulled wall simply ends.
- Let the alert do the waiting. Depth's alerts can tell you when a large wall appears near price, so you can look at the moment that matters.
Watch walls hold, get eaten or get pulled.Swiftedge Depth shows the live Bitcoin futures order book and every trade four times a second. Free, no sign-up.
Open Swiftedge DepthCommon questions
Is every pulled wall spoofing?
No. Spoofing means placing orders you never intend to fill, to mislead. Market makers also cancel orders all the time as price moves, as risk changes or as news arrives. From the public order book alone, intent cannot be proven.
Can Swiftedge tell me in advance whether a wall is real?
No. Swiftedge shows what is in the book and, afterwards, whether a wall held, was eaten or was pulled. In our data walls far from price were usually cancelled, but that describes the past, not a particular wall.
How do I see a pulled wall in Swiftedge Depth?
The bright band ends abruptly with no trade bubbles on its price. The daily BTC report also picks out a pulled, an eaten and a held wall each day, with a link that opens the moment in Depth.
Is spoofing illegal?
On regulated markets such as US futures, spoofing is prohibited by law. Crypto exchanges generally ban market manipulation in their own rules, but oversight differs from venue to venue and country to country.