Guide
Stacked imbalances: what they are and how long they hold
An imbalance is a price where one side was far more aggressive than the other. A stacked imbalance is several of them in a row on the same side, and many traders treat the zone as support or resistance. We measured every stacked imbalance on Bitcoin for 41 hours: 72 % were traded through within five minutes.
What an imbalance is
On a footprint chart, every price row has two numbers: volume sold into the bid and volume bought from the ask. An imbalance compares them diagonally: buying at one price against selling one row lower, because a buyer who lifts the ask at 100 meets the sellers who were hitting the bid at 99. When one side is at least three times the other (300 %, the most common setting), the row is an imbalance.
When imbalances stack
Three or more buy imbalances in a row means aggressive buyers dominated a whole band of prices in that candle; three or more sell imbalances, the same for sellers. The usual reading is that the band may act as support (buy stack) or resistance (sell stack) when price comes back. Swiftedge's footprint marks these runs with a bar along the edge of the candle.
Stacked imbalance zones in Swiftedge Depth
The Stacked imbalance zones indicator does the same on any chart type, including the plain heatmap. In each time window (15 seconds by default) it compares buying and selling on 5 USD rows, needs at least 40,000 USD of aggressive volume per row and three rows in a row, and draws a box that runs to the right until price trades through it. Every setting can be changed, including how far back zones are shown: the last hours, today, or from a time of day you choose.
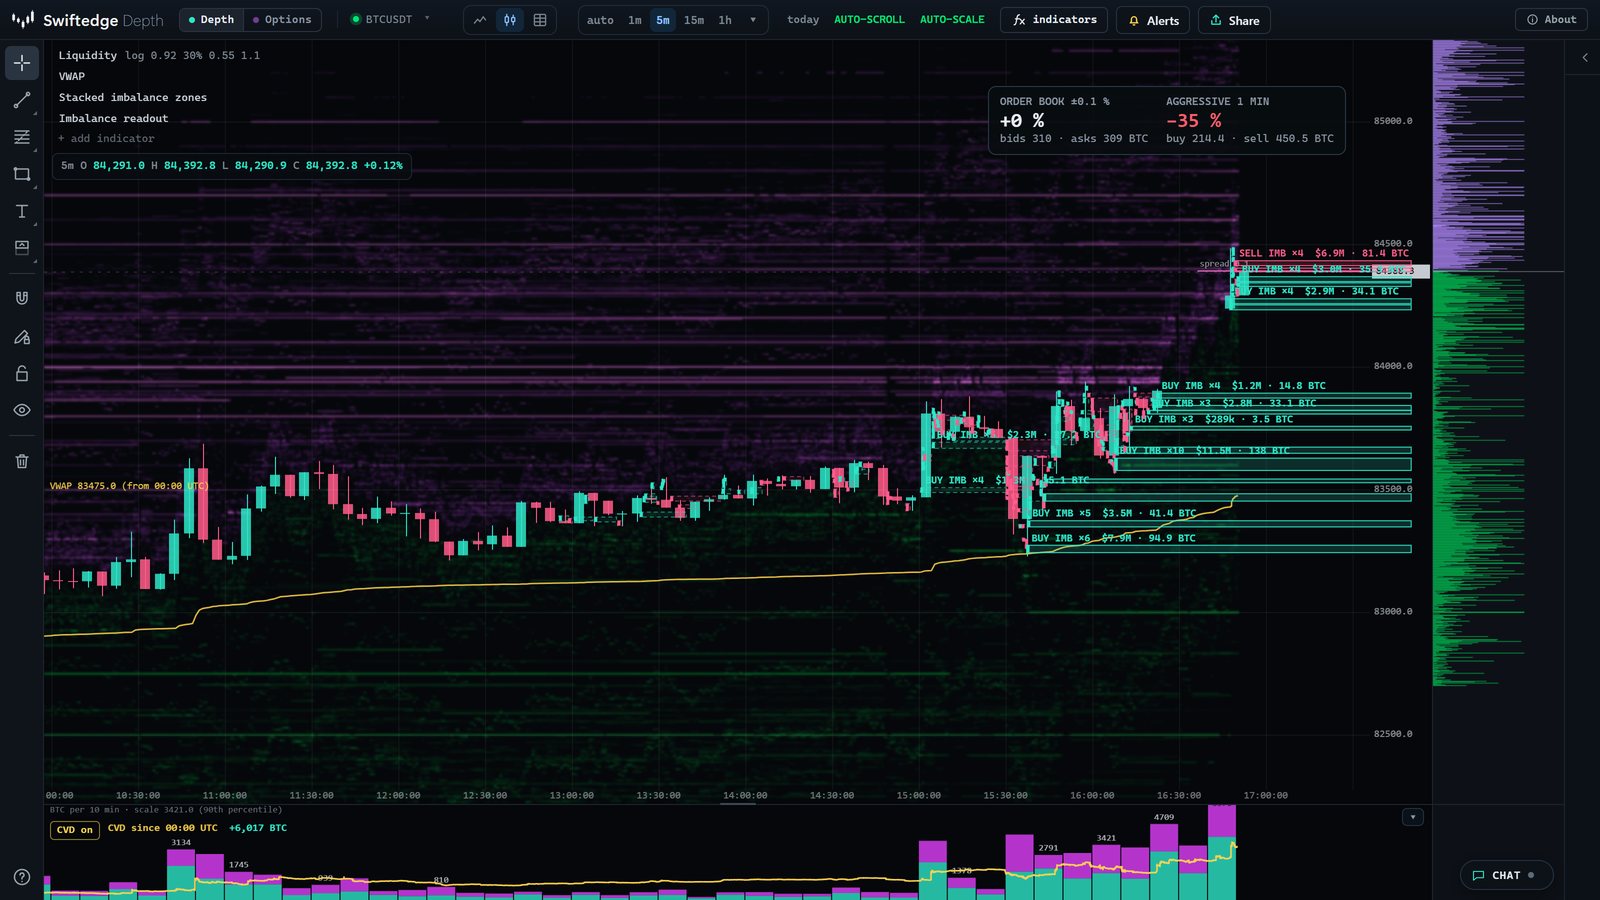
Open Depth with imbalance zones
What our data shows
If stacked imbalances were reliable support and resistance, most zones would hold for a while. On Bitcoin they mostly didn't:
| Stacked imbalance zones, BTCUSDT | Zones | Traded through within 1 min | 5 min | 15 min | 1 hour | 4 hours |
|---|---|---|---|---|---|---|
| Buy zones (support side) | 955 | 46 % | 73 % | 83 % | 91 % | 94 % |
| Sell zones (resistance side) | 960 | 45 % | 71 % | 84 % | 93 % | 97 % |
| All zones | 1,915 | 45 % | 72 % | 84 % | 92 % | 95 % |
| Levels in the stack | Zones | Traded through within 5 min | Still unbroken after 1 hour |
|---|---|---|---|
| 3 levels | 1,059 | 75 % | 7 % |
| 4 to 5 levels | 648 | 70 % | 10 % |
| 6 or more levels | 208 | 68 % | 7 % |
- Most zones are short-lived. Almost half were traded through within a minute and nearly three in four within five minutes. Only about one in twelve was still unbroken an hour later.
- Buy and sell zones behave alike. The two sides break at almost the same rate.
- Bigger stacks are not much sturdier. Zones of six or more rows broke within five minutes 68 % of the time, against 75 % for three rows.
None of this says a zone can't matter. It says a stacked imbalance on its own is common, about 50 per hour on Bitcoin with the default settings, and usually temporary. Zones that have already held for a while are the rare ones.
The imbalance readout
The second new indicator, Imbalance readout, shows two numbers in a corner of the chart: order book imbalance, (bids − asks) ÷ (bids + asks) within a chosen distance of price, and the same ratio for aggressive buying and selling over the last seconds or minutes. They turn colour beyond a threshold you set. Both describe the moment; neither is a forecast.
Common questions
What is a stacked imbalance?
Three or more imbalances in a row on the same side of a footprint candle: at each of those prices, aggressive buyers (or sellers) traded at least three times as much as the other side, compared diagonally.
Are stacked imbalances support and resistance?
Sometimes, but not usually for long. In 41 hours of Bitcoin data, 72 % of stacked imbalance zones were traded through within five minutes and about 8 % were still unbroken after an hour.
Why diagonal and not side by side?
Because that is how trades meet. Buyers lifting the ask at one price trade against the bid one step lower, so comparing the ask at a price with the bid below it measures the two sides of the same moment.
Can I change the settings?
Yes. In Swiftedge Depth you can change the time window, row size, ratio, minimum volume, number of rows in the stack and how far back zones are shown.